|
<< Click to Display Table of Contents >> ChartScale |


|
ChartScale
|
<< Click to Display Table of Contents >> ChartScale |
|
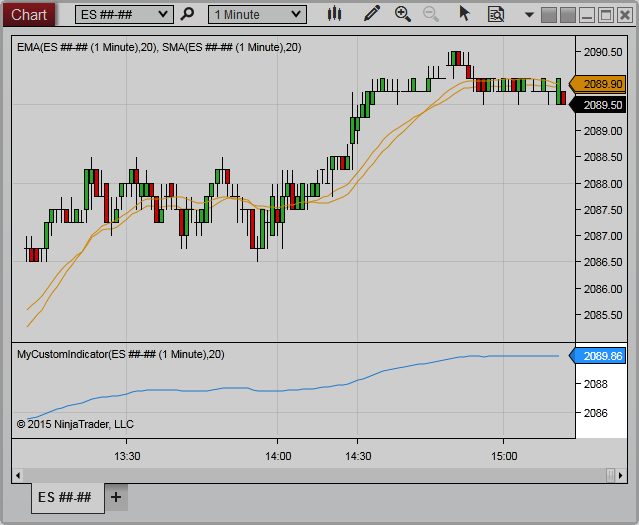
The ChartScale class includes a range of properties related to the Y-Axis values of the ChartPanel on which the calling script resides. The ChartScale can be configured to Right, Left, or Overlay.
Returns the number of device pixels between the value passed to the method representing a series point value on the chart scale |
|
Returns the series value on the chart scale determined by a y pixel coordinate on the chart |
|
Returns the series value on the chart scale determined by a WPF coordinate on the chart |
|
Returns the chart's y-pixel coordinate on the chart determined by a series value represented on the chart scale |
|
Returns a WPF coordinate on the chart determined by a series value represented on the chart scale |
|
Indicates the overall distance (from top to bottom) of the chart scale in device pixels |
|
Indicates if the chart scale is viewable on the UI |
|
The difference between the chart scale's MaxValue and MinValue represented as a y value |
|
The highest displayed value on the chart scale |
|
The lowest rendered value on the chart scale |
|
The panel on which the chart scale resides |
|
Represents a number of properties available to the Chart Scale which can be configured to change the appearance of the scale |
|
Indicates the location of the chart scale relative to the chart control |
|
Indicates the overall distance (from left to right) of the chart scale in device pixels |