What is Volume Analysis in Futures Trading?
While much of technical analysis focuses on price action, volume analysis can be just as important when it comes to understanding market trends and sentiment. Volume typically refers to the number of contracts traded for one day or trading session. You can think of volume as a vote for the direction of the trend.
When a trader places an order to buy or sell, the expectation is that the market will go up or down, and the size of each order adds to the total trading volume for that day. Generally, higher volume represents greater validation or confidence in the current price direction.
Popular Volume-Based Indicators to Analyze the Futures Markets
Volume Study
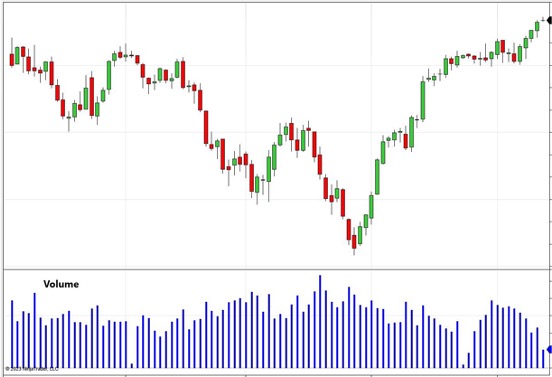
The standard volume study is shown as a histogram chart usually underneath a price chart.
These bars represent the number of contracts traded for each bar time interval in that chart, e.g., 10-min, daily, weekly, or any bar timeframe.
- If volume is increasing during a trend, it could be reflective of a conviction in the direction by market participants.
- If price is trending on weakening volume, it might indicate low conviction and a weakening or reversal of the current trend.
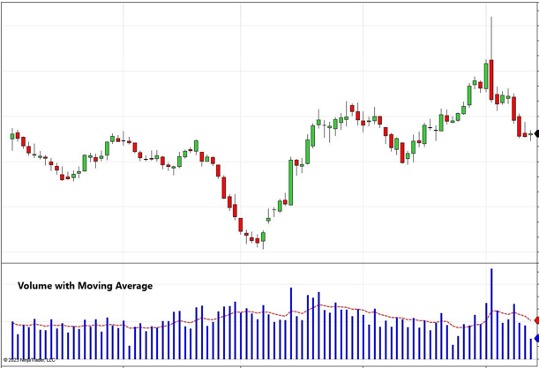
Volume Average
By applying a simple average to the volume indicator, you can compare the volume for any single bar against that average, making it easier to spot higher or lower volume bars.
- If a significant price move occurs with higher-than-average volume, the higher volume would be a confirming signal.
- If a significant price moves occurs with lower-than-average volume might indicate less trader conviction in the price move.
Often a spike in volume above the average volume, on a large range up or down bar, can indicate a new surge in price action, either a sharp trend reversal or continued follow through in the direction of the current trend.
Volume Profile
Volume profile is a powerful analysis visualization that reflects the number of contracts that have traded at a certain price or price range. This analysis can help traders visualize where the majority of trading action has occurred throughout the trading day.
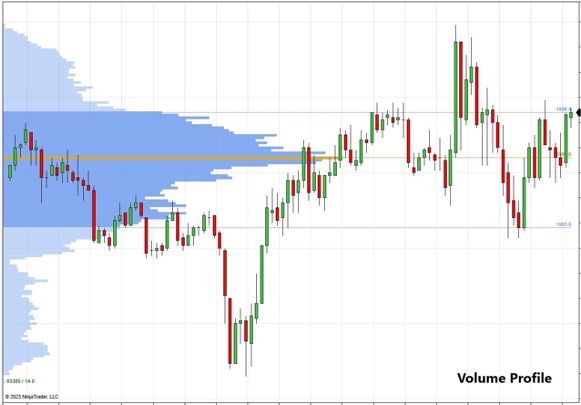
The shape of the volume profile is often compared to a bell curve with the idea that 68% of all trades should occur around the most traded-at price which is referred to as the ‘point of control’. The height of the bell curve is referred to as the ‘value area’ and if displayed as the blue shared area in the chart to the right. The ‘point of control’ is reflected by the yellow line.
As the trading day unfolds, traders can gauge which price levels have the most trading activity. These price levels can then be used to help identify key areas of support and resistance providing an extremely valuable tool for intra-day traders.
The Order Flow+ feature set for NinjaTrader Desktop includes a volume profile indictor featuring multiple visualization modes and plotting variables allowing traders to customize volume profile to best fit their trading style.
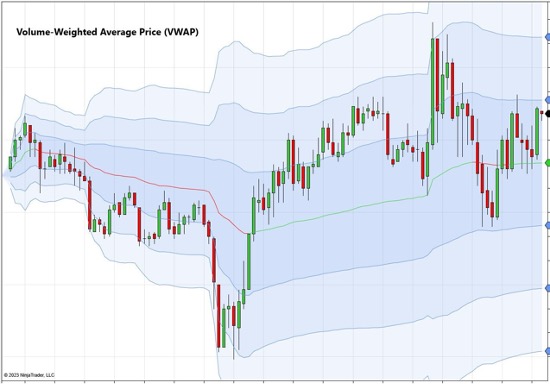
Volume-Weighted Average Price
Volume Weighted Average Price, or “VWAP” as it is known, combines volume and price for a single trading day to create a set of plotted lines on the chart that can be useful in identifying key areas of support and resistance.
The center VWAP value is calculated by multiplying the price of each trade by the volume of each trade. These results are then summed up and divided by the number of total contracts traded on the day. This dynamic approach gives more price weight to those trades with greater trade size.
The Order Flow VWAP available in NinjaTrader provides further market insight by plotting multiple standard deviation bands from the center VWAP. These outer bands can serve as additional support and resistance levels as well as a potentially overbought or oversold indication.

Technical Analysis Made Easy
Build your futures trading foundation using technical analysis to identify trends, support and resistance, and key chart patterns.
Learn How to Identify Market Trends with Pros at NinjaTrader
Join our free livestreams as we prepare, analyze and target live futures trade setups in real time.
Watch our industry pros trade the futures market open every weekday at 9:15 am ET and the market close at 3:00pm ET using NinjaTrader’s award-winning charting and analysis tools.
Explore Volume Based Technical Analysis with Your Free NinjaTrader Account
Volume-based indicators can complement all other types of technical analysis including trend, momentum, volatility and more. By analyzing volume along with price, traders can gain better insights and understanding of the sentiment and conviction of the markets they trade.
Get started on your trading journey with NinjaTrader’s free futures charts and simulated trading powered by real-time futures market data. Practice chart building, explore the available technical analysis tools and trade in a risk-free simulation environment until you are ready for the live markets.