Visualize the futures markets using charts and indicators
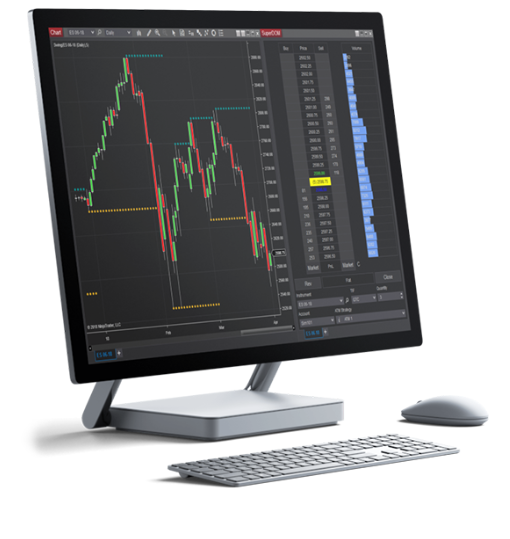
At the center of technical analysis is the ability to plot market data on a price chart and apply indicators to create visualizations of futures markets trading activity.
Price charts are foundational trading tools that allow you to thoroughly examine the market environment—both in real time and using historical price data—to make more informed trading decisions.
The NinjaTrader Desktop includes over 10 chart styles and more than 100 indicators. Traders can also tap into thousands of third-party add-on tools to customize their technical analysis.
Basic Properties of a Price Chart
Every futures trader has their own unique chart-building process based on their trading style and approach to market analysis. When creating a trading chart, the following initial properties must be set and defined:
- The contract Instrument or Instruments
- The chart Style determines the look of the bars, like Candlestick, open-high-low-close (OHLC), or Line.
- The bar Type defines how the data is parsed into bars, like 5-minute, daily, or weekly
Once you've created a chart in the NinjaTrader platform, it's easy to change the Instrument, Style, and Timeframe (type) on the fly with just a few clicks.
Popular Chart Styles and Indicators Available in NinjaTrader Platforms
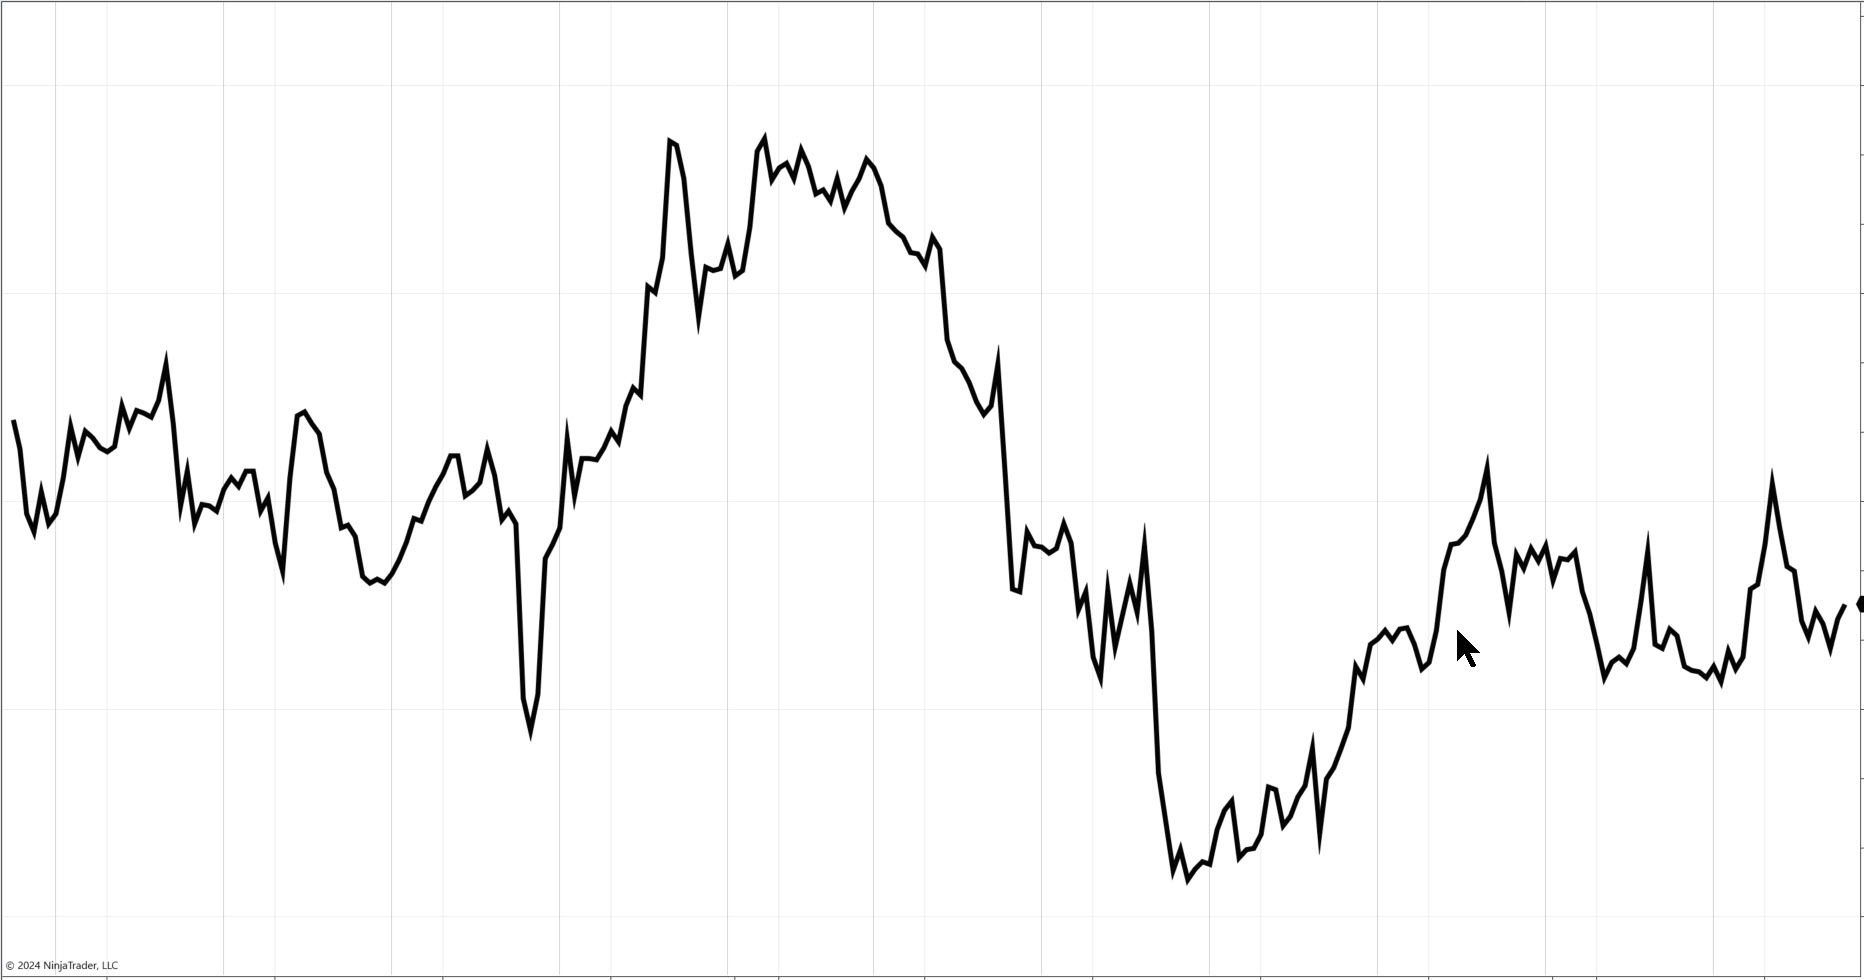
Line on Close Chart
One of the most common types of charts is a Line on Close chart, which plots a single line, bar by bar, connecting the close of each bar.
Line on Close charts provide a simplified visualization of pure price movement to help traders better identify trends by reducing the number of data points displayed. This simplification makes the Line on Close chart a great starting point for new traders.
Line on Close charts are frequently used to compare historical price data for multiple instruments in the same chart.
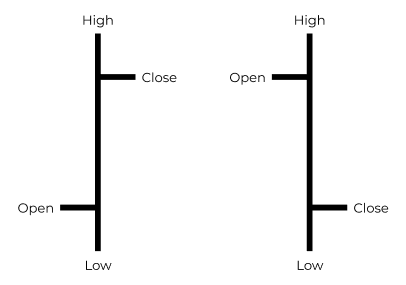
Open-High-Low-Close (OHLC) Bar Chart
OHLC bar charts display four key price points on the bar—open, high, low, and close—allowing you to visualize and analyze real-time and historical price data. The highest and lowest prices seen during the bar time frame determine the size of the bar high to low.
- The open of the bar is the first recorded price of the bar and is indicated by a small horizontal hash mark to the left.
- The close of the bar is the last recorded price of the bar and is indicated by a small horizontal hash mark to the right.
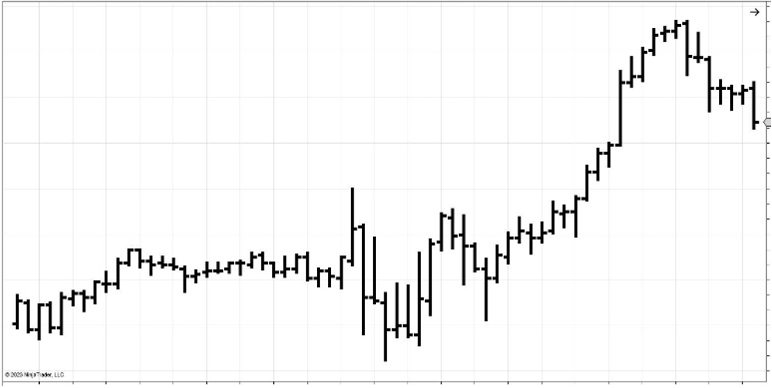
Each OHLC bar includes a time and date stamp along the bottom X-axis of the chart which is the closing time and date of the bar.
OHLC bar charts can convey the magnitude of the trading range (or volatility) for both a single bar and a series of bars throughout the chart.
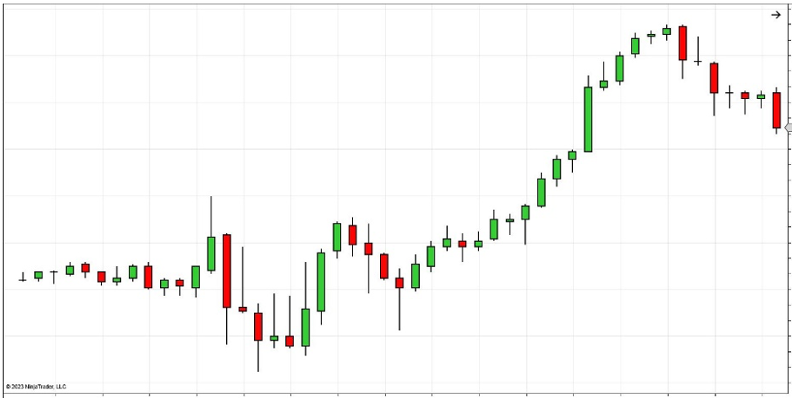
Candlestick Chart
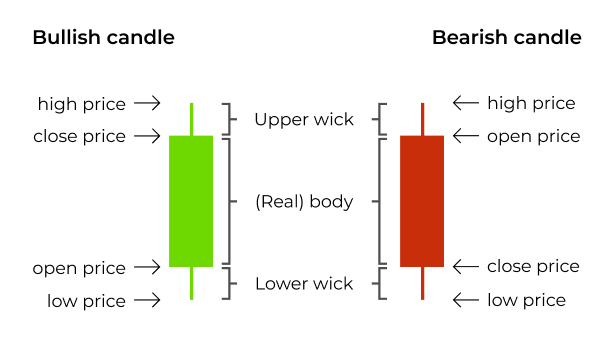
Candlestick charts are a popular visual variation of standard OHLC bar charts. The main difference is that the body (thick part) of the candlestick is built using only the open and close bar prices, and the high and low of the bar are presented as thin lines above and below the candle body called wicks.
The color of the candle body reflects the relationship between the open and close:
- Green candle body = close of the bar is above the open, denoting a positive up or bullish candle
- Red candle body = close of the bar is below the open, denoting a negative down or bearish candle
Candlestick bar colors can be customized, and some traders choose to use white for bullish candles and black for bearish candles.
The lines above and below the candle body are called the upper and lower wicks, and they extend to the high and low of the bar.
- When prices move up (buying pressure) from the low of the candle, a buyer’s wick is created.
- When prices move down (selling pressure) from the high of the candle, a seller's wick is created.

Technical Analysis Made Easy
Build your futures trading foundation using technical analysis to identify trends, support and resistance, and key chart patterns.
Learn how to trade futures with the pros at NinjaTrader
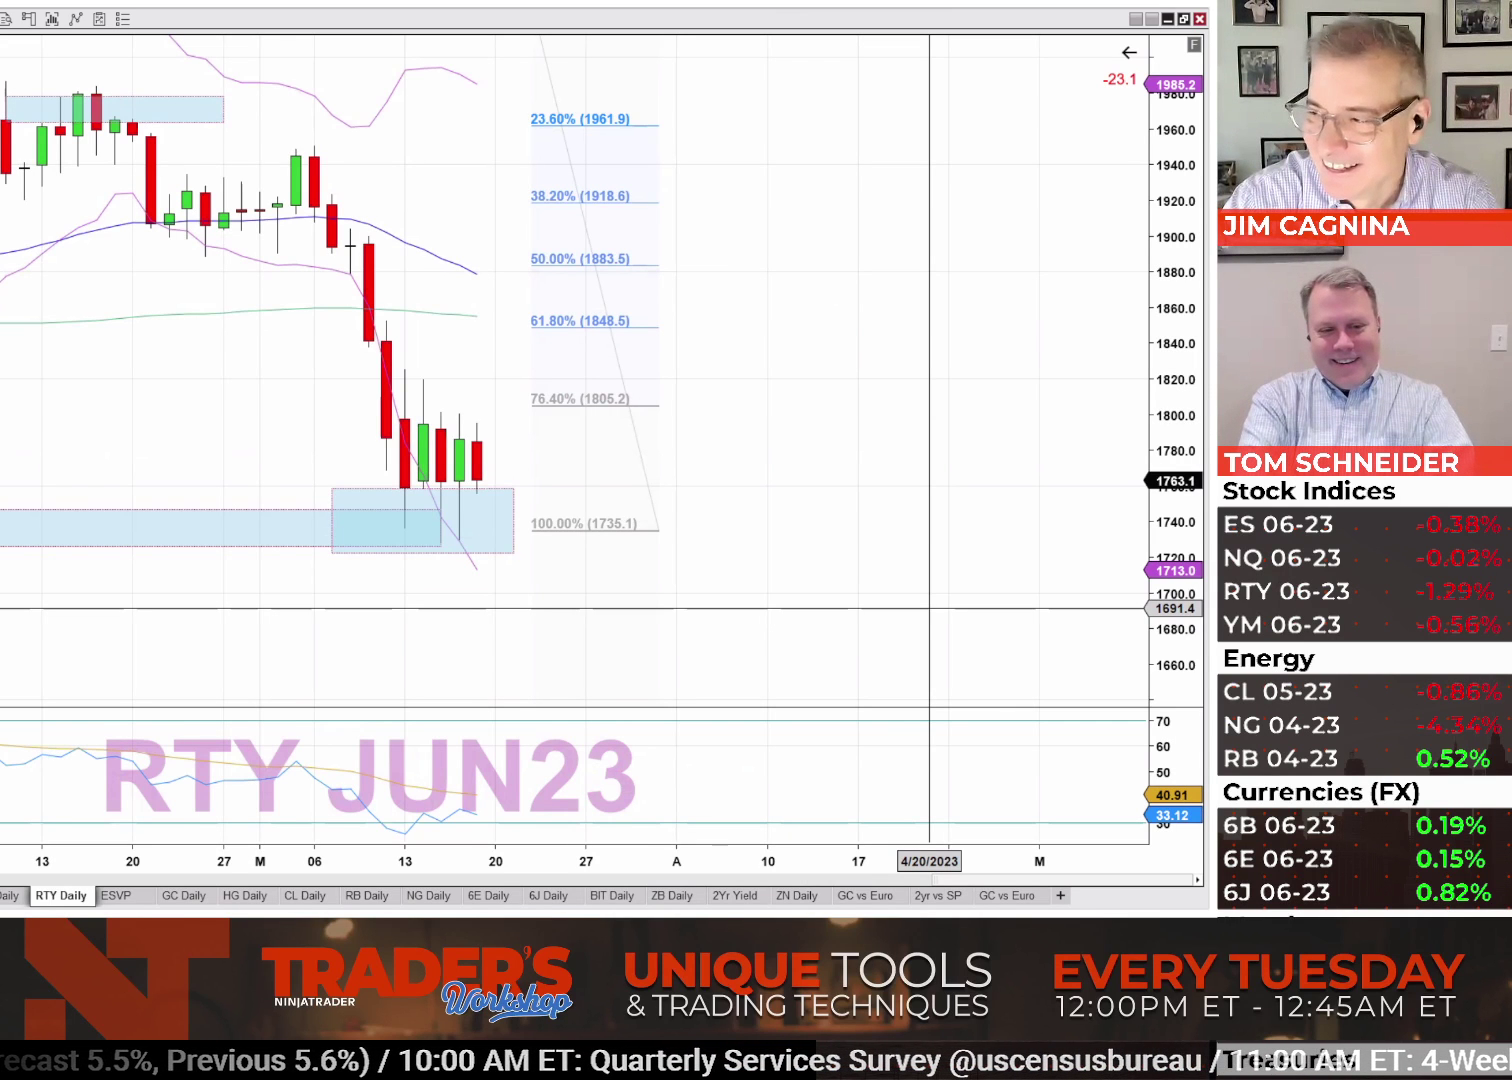
Join our free livestreams as we prepare, analyze, and target live futures trade setups in real time.
Watch our industry pros trade the futures market open every weekday at 9:15 am ET and the market close at 3:00 pm ET using NinjaTrader’s award-winning charting and analysis tools.
Explore Chart Styles and Bar Intervals on Free Trading Charts
Understanding chart styles and how price bars represent market action is essential to effective technical analysis.
Get started on your trading journey with NinjaTrader’s free futures charts and simulated trading powered by real-time futures market data. Practice chart building, explore our many technical analysis tools, and trade in a risk-free simulation environment until you’re ready for the live markets.