How is momentum used in the technical analysis of futures markets?
Understanding market behavior in futures trading is more than just observing trend. Wouldn’t it be useful to know if the trend could be stalling or even reversing?
Momentum indicators measure the rate at which prices are changing or accelerating and can provide insight to when the trend might end or when prices may potentially reverse.
Incorporating momentum indicators in your futures trading is a smart way to understand the strength and direction of the current trend of a market.
Popular Momentum Indicators to Analyze the Futures Markets
Relative Strength Index (RSI)
The most common momentum indicator used by futures traders is the Relative Strength Index or RSI. This indicator compares the strength of moves on up bars vs. down bars. The speed and strength of this price action results in the trader’s ability to determine if a futures market is overbought or oversold.

The RSI is a bounded study ranging from 0 – 100, with thresholds of 30 and 70 used as traditional oversold and overbought levels.
- When the RSI falls below 30, the underlying is considered oversold (trading well below its recent average price)
- When the RSI is above 70, the underlying is considered overbought (trading well above its recent average price)
- Extreme levels may suggest that a trend is over-extended and the price trend might be exhausted or may even reverse.
Since the RSI has the same value scale regardless of the traded instrument’s price, you can compare RSI values across multiple futures markets to get a sense of which are overbought or oversold.
Stochastics
The Stochastics indicator is another popular tool that is used to visualize a futures market’s current momentum. Stochastic measures where the current price is in relation to extreme prices over a 14-bar lookback in order to identify overbought or oversold conditions.

The Stochastics indicator includes two lines:
- The %K line is calculated by taking the difference of current price and the Low over the lookback period, then dividing by the difference of the highest high and lowest low over the same period.
- The %D line is a smoothed %K line which reflects a simple moving average of the %K line (usually a 3-period average)
Similar to the RSI, Stochastics is also a bounded study with a scale of 0 to 100.
- During a market downtrend, the Stochastic value will become more oversold (i.e. less than 20)
- During a market uptrend, the Stochastic value will become more overbought (i.e. greater than 80)
- When the %K line crosses the %D line, this may signal a potential directional change which can be a stronger signal when these lines are in overbought or oversold territory

Commodity Channel Index (CCI)
The Commodity Channel Index (CCI) is a unique momentum indicator that measures the difference of the typical bar price from its moving average using the mean deviation of that difference over a period of bars. Unlike other typical momentum indicators, the CCI value is not range bound.
Futures traders can use the CCI to help identify overbought and oversold price levels when the CCI value is at extreme levels. CCI can also be used to help identify and confirm trend reversals as well as price divergences from CCI, which may indicate that price will potentially follow the trend of the CCI.
Since the CCI is not rangebound, overbought and oversold levels may vary depending on the futures market you are analyzing and the bar interval the trader is using.

Technical Analysis Made Easy
Build your futures trading foundation using technical analysis to identify trends, support and resistance, and key chart patterns.
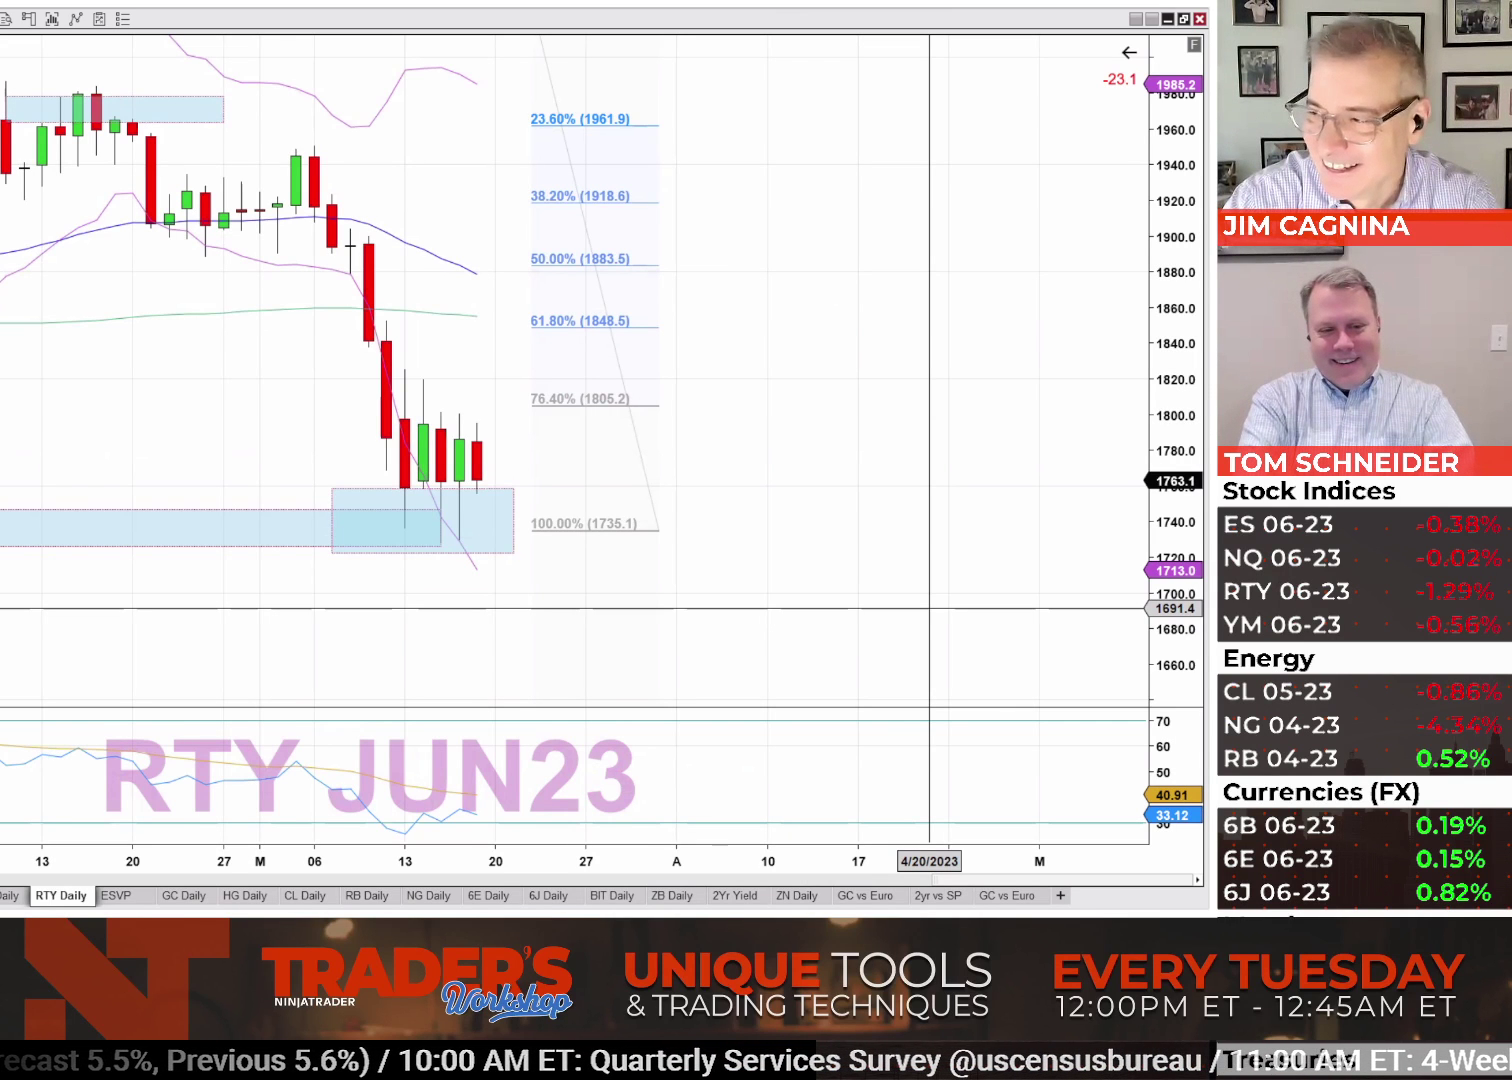
Learn How to Identify Market Trends with Pros at NinjaTrader
Join our free livestreams as we prepare, analyze and target live futures trade setups in real time.
Watch our industry pros trade the futures market open every weekday at 9:15 am ET and the market close at 3:00pm ET using NinjaTrader’s award-winning charting and analysis tools.
Explore Momentum Indicators for Free with NinjaTrader
Finding the right combination of technical indicators that works for you requires experimentation and observation.
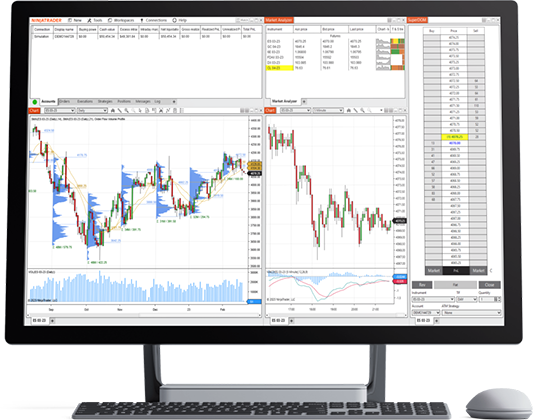
Get started with NinjaTrader’s award-winning trading platforms and simulated trading powered by real-time futures market data. Practice chart building, explore the available technical analysis tools and trade in a risk-free simulation environment until you are ready for the live markets.