Announcement

Collapse

Looking for a User App or Add-On built by the NinjaTrader community?

Visit NinjaTrader EcoSystem and our free User App Share!

Have a question for the NinjaScript developer community? Open a new thread in our NinjaScript File Sharing Discussion Forum!
See more
See less

Partner 728x90

Collapse

I will Develop your Indicator or Strategy for FREE

Collapse
This topic is closed.
X
X
 
  • Filter
  • Time
  • Show
Clear All
new posts

    #91
    Originally posted by Trader Mike View Post
    Thanks Harry, This works great except when the day session opens the highs and lows from the Globex seem to follow the market. I have been playing with the setting and cant seem to find the right combination. is there a way to have the globex highs and low show for the remainder of the current RTH? Thanks for your help.
    The SessionPivots indicator plots High, Low and Close of the prior day's ETH or RTH session. It does not plot the Globex night session High and Low.

    If you want to display the Globex High and Low, I suggest to use the Opening Range indicator, which can be found here:

    The best futures trading community on the planet: futures trading, market news, trading charts, trading platforms, trading strategies


    Sample chart is attached.
    Attached Files

    Comment


      #92
      Thanks Harry, unfortunately I am not a member of Big Mikes. I will have to look into that. I am surprised that there is not a simple solution as it seems many people have tried to handle this.

      Comment


        #93
        Fib Bands Indicator

        Hi,
        it seems that michel is not around anymore. So maybe someone else can help me.

        I am looking for a fib band indicator. How it should work is described in this book on page 150.


        Basically it is just an EMA with TrueRange based bands around it. The math behind it is:
        Code:
        MA = EMA (Close, 34);
        TR = EMA (TrueRange, 8);
        
        
        UpperBand 3   = MA + TR * 4,23;
        UpperBand 2   = MA + TR * 2,62;
        UpperBand 1   = MA + TR * 1,62;
        MidBand          = MA;
        LowerBand 1   = MA - TR * 1,62;
        LowerBand 2   = MA - TR * 2,62;
        LowerBand 3   = MA - TR * 4,23;

        Comment


          #94
          This is a modified Keltner Channel. The original Keltner Channel uses a SMA of the typical price as the center line and then adds/subtracts a multiple of the average true range to calculate the band.

          The Fib bands are calculated from an EMA of the closing price, then 3 multiples of an exponential average of the true range are used to create the Fib bands.

          Note: The ATR uses Wilder's exponential average, where k = 1/n is the smoothing constant. The fib bands use the standard exponential average with k = 2/(n+1) as a smoothing constant. This means that an ATR(10) uses k = 0.1, whereas EMA(TR, 10) uses k = 0.182. However, you can convert them, for example the equality

          ATR(10) = EMA(TR, 19)


          allows conversion between the two different approaches.


          I have coded a Universal Keltner Channel, which can be found here:

          The best futures trading community on the planet: futures trading, market news, trading charts, trading platforms, trading strategies


          You can set the multiple to a Fib ratio and create a fib band. If you apply that indicator three times with different settings, you get your fib channels. You can also contact me via private message to modify the indicator to suit your needs.

          Originally posted by turbotrader View Post
          Hi,
          it seems that michel is not around anymore. So maybe someone else can help me.

          I am looking for a fib band indicator. How it should work is described in this book on page 150.


          Basically it is just an EMA with TrueRange based bands around it. The math behind it is:
          Code:
          MA = EMA (Close, 34);
          TR = EMA (TrueRange, 8);
          
          
          UpperBand 3   = MA + TR * 4,23;
          UpperBand 2   = MA + TR * 2,62;
          UpperBand 1   = MA + TR * 1,62;
          MidBand          = MA;
          LowerBand 1   = MA - TR * 1,62;
          LowerBand 2   = MA - TR * 2,62;
          LowerBand 3   = MA - TR * 4,23;
          Attached Files

          Comment


            #95
            Originally posted by Trader Mike View Post
            Thanks Harry, unfortunately I am not a member of Big Mikes. I will have to look into that. I am surprised that there is not a simple solution as it seems many people have tried to handle this.
            There cannot be a simple solution. Traders have their PCs setup in local time around the world. I am sitting in Europe and we do not have the same daylight savings schedule as the US. The only way to get correct session times - and this includes the Globex range - is to convert the exchange time to local time and vice versa. The information needed for conversion - that is the timezone of the exchange - is available via the session template of the chart.

            I have coded various indicators, this includes

            - Session Pivots for ETH and RTH
            - Jackson Zones ETH and RTH
            - Current day's range
            - Globex range and opening range
            - VWAP for ETH and RTH
            - Average daily range as target bands
            - Noise band based on failure moves

            which all rely on the correct session information. All indicators are available for free at www.bigmiketrading.com (elite membership is required to download them). You can also send me a private message, I don't mind sending an indicator, if I am not getting hundreds of requests.

            Comment


              #96
              Thanks Harry for your help.
              I did not know that this is only an modified Keltner Channel.

              Originally posted by Harry View Post
              This is a modified Keltner Channel. The original Keltner Channel uses a SMA of the typical price as the center line and then adds/subtracts a multiple of the average true range to calculate the band.

              The Fib bands are calculated from an EMA of the closing price, then 3 multiples of an exponential average of the true range are used to create the Fib bands.

              Note: The ATR uses Wilder's exponential average, where k = 1/n is the smoothing constant. The fib bands use the standard exponential average with k = 2/(n+1) as a smoothing constant. This means that an ATR(10) uses k = 0.1, whereas EMA(TR, 10) uses k = 0.182. However, you can convert them, for example the equality

              ATR(10) = EMA(TR, 19)


              allows conversion between the two different approaches.


              I have coded a Universal Keltner Channel, which can be found here:

              The best futures trading community on the planet: futures trading, market news, trading charts, trading platforms, trading strategies


              You can set the multiple to a Fib ratio and create a fib band. If you apply that indicator three times with different settings, you get your fib channels. You can also contact me via private message to modify the indicator to suit your needs.

              Comment


                #97
                fibo pivot request

                Hello guys..
                Im a new member with less than enough programming skills, so i need some help.
                I'd like to have a fibo pivot indicator. I know there are a plenty on the forums, but unfortunately none of them show the levels which I desire.
                the calcualtion method of the levels:

                R3 = Pivot + 1.000 * (H - L)
                R2 = Pivot + 0.618 * (H - L)
                R1 = Pivot + 0.382 * (H - L)
                Pivot = ( H + L + C ) / 3
                S1 = Pivot - 0.382 * (H - L)
                S2 = Pivot - 0.618 * (H - L)
                S3 = Pivot - 1.000 * (H - L)

                the high/low/close based on the prvious day or week.
                I've been calculating and drawing this lines own hands, but its a pain.

                Any help is appreciated and sorry my poor english!!
                Best wishes
                Andre
                Attached Files

                Comment


                  #98
                  This indicator is already available. Please use the SessionPivotsV39 - version 39 is posted at www.bigmiketrading, com, version 38 is in the download section of this forum, will update it as well.


                  The best futures trading community on the planet: futures trading, market news, trading charts, trading platforms, trading strategies


                  Indicator settings:

                  The indicator requires the use of the correct session template for 6B, that is CME FX Futures ETH. You need to decide, if you want to take the close at 5:00 PM EST or the settlement price at 3:00 PM EST.

                  Settlement price: You need to set the indicator to DailyBars and make sure that you have loaded daily data, which supplies the settlement price. For example Kinetick EOD does supply the settlement price.

                  Close: You need to set the indicator to CalcFromIntradayData, and will calculate the pivots by using the close.

                  I understand that you have used the close to calculate the Fibonacci pivots. For FOREX this solution is not bad, as the FOREX markets close at that time. However, website such as www.mypivots.com use the settlement price for calculating pivots, so it is not obvious to opz for the close instead of the settlement.

                  Now set the indicator to Fibonacci to display Fibonacci pivots. You can also set it to Jackson to display Jackson Zones, which are very similar.

                  THe charts are attached below. In case that you wish to see the plots for the previous days as well, you can use the PivotZones indicator, which is available here:

                  The best futures trading community on the planet: futures trading, market news, trading charts, trading platforms, trading strategies


                  Harry

                  Originally posted by andre.adamov View Post
                  Hello guys..
                  Im a new member with less than enough programming skills, so i need some help.
                  I'd like to have a fibo pivot indicator. I know there are a plenty on the forums, but unfortunately none of them show the levels which I desire.
                  the calcualtion method of the levels:

                  R3 = Pivot + 1.000 * (H - L)
                  R2 = Pivot + 0.618 * (H - L)
                  R1 = Pivot + 0.382 * (H - L)
                  Pivot = ( H + L + C ) / 3
                  S1 = Pivot - 0.382 * (H - L)
                  S2 = Pivot - 0.618 * (H - L)
                  S3 = Pivot - 1.000 * (H - L)

                  the high/low/close based on the prvious day or week.
                  I've been calculating and drawing this lines own hands, but its a pain.

                  Any help is appreciated and sorry my poor english!!
                  Best wishes
                  Andre
                  Attached Files
                  Last edited by Harry; 07-01-2012, 08:36 AM.

                  Comment


                    #99
                    I would appreciate your help modifying the attached time and sales indicator to have the option to display color coding based on up/down tick continuation instead of bid/ask.

                    I know ranchodinero has a free time and sales indicator but their version does not display time down to the second as this one does. Trying to combine the best of both worlds.
                    Attached Files

                    Comment


                      Can you make a HiLo Activator?!

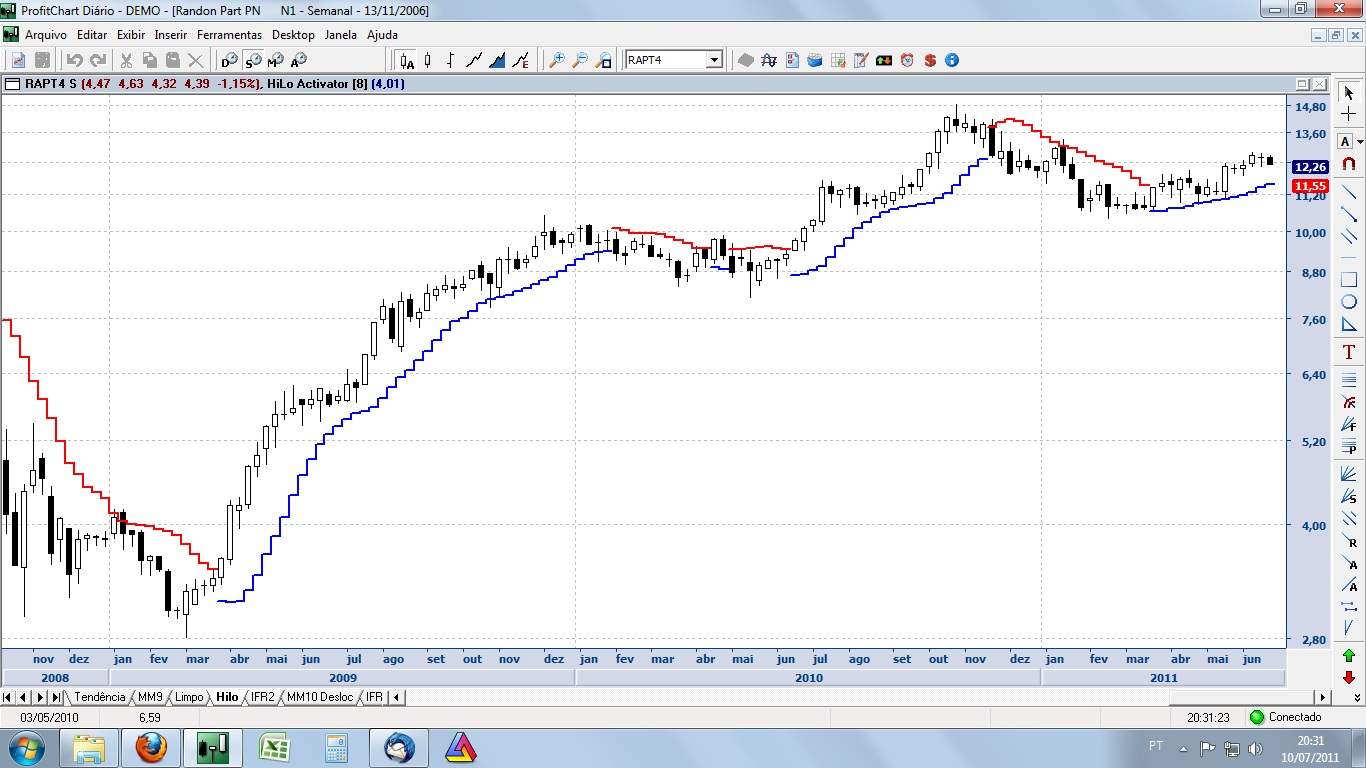
                      Can you make a HiLo Activator like in the image?
                      Thank you,
                      Pedro Ivo
                      Last edited by pedroivo96; 07-04-2012, 10:36 PM.

                      Comment


                        Pedro,

                        You would need to tell us the formula used.

                        Comment


                          Originally posted by Harry View Post
                          Pedro,

                          You would need to tell us the formula used.
                          Harry,I use this HiLo Activator:http://www.ninjatrader.com/support/f...0&d=1201990653
                          Thank you,
                          Pedro Ivo

                          Comment


                            Originally posted by pedroivo96 View Post
                            Harry,I use this HiLo Activator:http://www.ninjatrader.com/support/f...0&d=1201990653
                            Thank you,
                            Pedro Ivo
                            That formula is flawed. Have quickly coded something, but not finished yet. I think it can be used as a trendfilter. High and low are calculated via a moving average. The basic indicator uses a SMA, but I will add some options to use something like 30 different moving averages. Paintbars for identifying the trend, arrows and sound alerts for the trend change.

                            A preview is below.
                            Attached Files

                            Comment


                              Just discovered a simple working version of the HiLowActivator for NinjaTrader.

                              You can find it here:

                              I do not have any Ninja code but I can explain how this indicator is created. All you need is a 3 period simple moving average based on the bar highs, and another based on the bar lows. The indicator flips to the underside of the price action when a bar closes above the high average. it flips to the upperside of the price action when a bar closes below the low average. You can choose whether to use the values based on the current bar's value or the previous bar's value.

                              Comment


                                Originally posted by Harry View Post
                                That formula is flawed. Have quickly coded something, but not finished yet. I think it can be used as a trendfilter. High and low are calculated via a moving average. The basic indicator uses a SMA, but I will add some options to use something like 30 different moving averages. Paintbars for identifying the trend, arrows and sound alerts for the trend change.

                                A preview is below.
                                Thank you very much Harry!!!The indicator is getting good!When you finish making the indicator tell me!
                                Thank you,
                                Pedro Ivo

                                Comment

                                Latest Posts

                                Collapse

                                Topics Statistics Last Post
                                Started by Perr0Grande, Today, 08:16 PM
                                0 responses
                                2 views
                                0 likes
                                Last Post Perr0Grande  
                                Started by elderan, Today, 08:03 PM
                                0 responses
                                5 views
                                0 likes
                                Last Post elderan
                                by elderan
                                 
                                Started by algospoke, Today, 06:40 PM
                                0 responses
                                10 views
                                0 likes
                                Last Post algospoke  
                                Started by maybeimnotrader, Today, 05:46 PM
                                0 responses
                                11 views
                                0 likes
                                Last Post maybeimnotrader  
                                Started by quantismo, Today, 05:13 PM
                                0 responses
                                7 views
                                0 likes
                                Last Post quantismo  
                                Working...
                                X