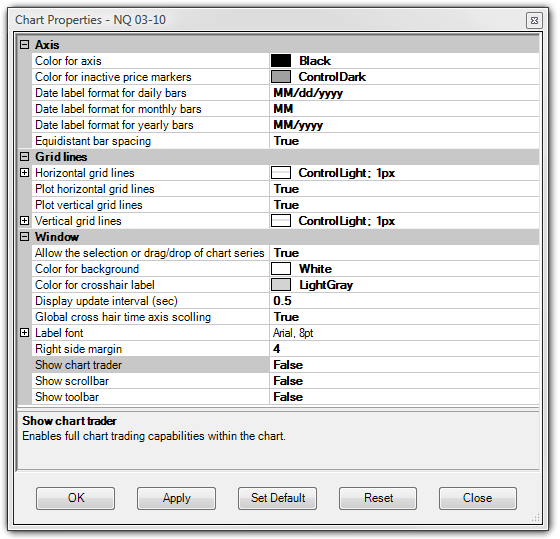
Color for axis
|
Sets the color for both vertical and horizontal chart axis
|
Color for inactive price markers
|
Price markers display the current price of bars and indicators on the Y-axis. When looking at the current bar, the price markers will take the color of the data series. When scrolling back through historical bar data, the markers are inactive (not real-time) and will be displayed by the color set on this property
|
Date label format for daily bars
|
Sets the format for displaying the date in the X-axis for daily bars
|
Date label format for monthly bars
|
Sets the format for displaying the date in the X-axis for monthly bars
|
Date label format for yearly bars
|
Sets the format for displaying the date in the X-axis for yearly bars
|
Equidistant bar spacing
|
Enables or disables plotting bars an equal distance from each other. Please see the "Working with Price Data" section of the Help Guide for more information.
|
Horizontal grid lines
|
Sets the drawing properties of the horizontal grid lines
|
Plot horizontal grid lines
|
Enables or disables the plotting of horizontal grid lines
|
Plot vertical grid lines
|
Enables or disables the plotting of vertical grid lines
|
Vertical grid lines
|
Sets the drawing properties of vertical grid lines
|
Allow the selection or drag/drop of chart series
|
Enables or disables the selection of Data Series and indicators for drag and drop
|
Color for background
|
Sets the chart background color
|
Color for crosshair label
|
Sets the color for the cross hair label
|
Display update interval (sec)
|
Sets the frequency the chart display is updated (A value of 200 ms or less (0.2) will be CPU intensive and can adversely affect performance especially in high volatile market activity.)
|
Global cross hair time axis scrolling
|
When true and global cross hair is enabled on multiple charts, the non-active chart will automatically scroll the horizontal axis to stay aligned with the X-axis value of the active chart.
|
Label font
|
Sets the font display properties for the chart
|
Right side margin
|
Sets the spacing between the Y-axis and the current bar in pixels
|
Show chart trader
|
Enables or disables the Chart Trader order entry window for direct trading from within a chart
|
Show scrollbar
|
Enables or disables showing the horizontal chart scroll bar
|
Show toolbar
|
Enables or disabled showing the chart tool bar
|