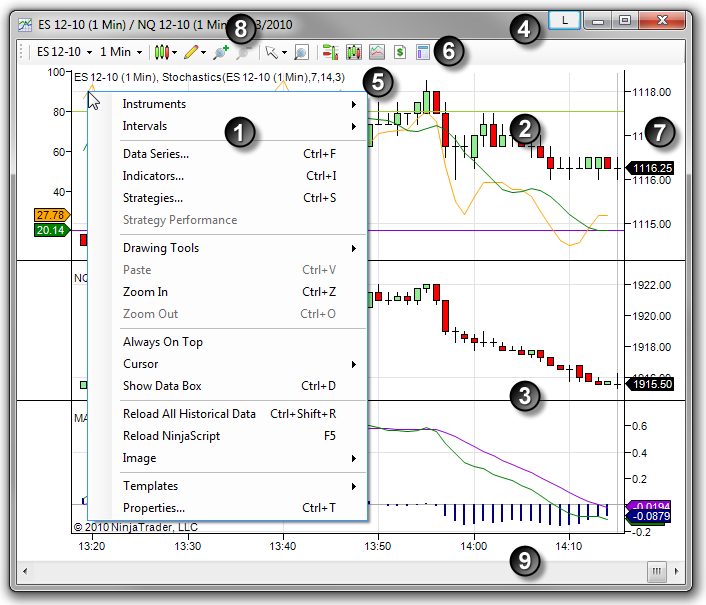
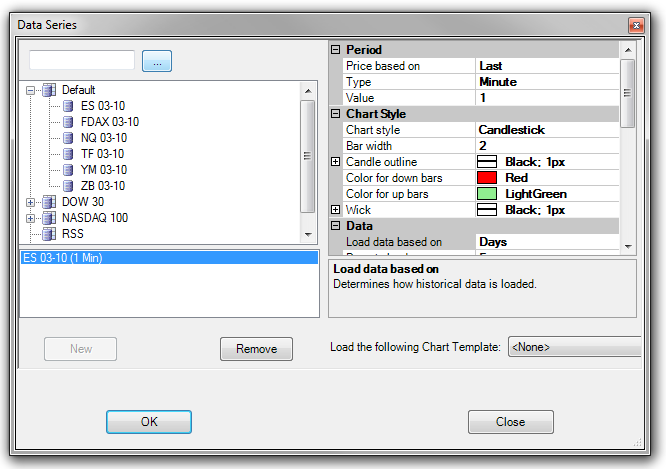
Operations > Charts >

Creating a Chart

Print this Topic Previous pageReturn to chapter overviewNext page

The following section covers how to open a NinjaTrader chart.


tog_minusHow to open a new chart

Opening a New Chart

To create a new chart, select the File menu from the NinjaTrader Control Center, then select the New menu and select the menu item Chart. The Data Series window will open where you can choose an instrument and an optional Template to apply to the chart. Please see the "Working with Price Data" page of the Help Guide for more information.


NinjaTrader does not limit the number of chart windows that can be opened, however more open windows will require more PC resources. Please see the Performance Tips page for more information on improving PC performance.


Selecting an Instrument

Once inside the Data Series window, there are multiple ways to choose an instrument. You can select an instrument from the available instrument lists, type the instrument symbol into the empty instrument field and press the Enter key, or use the Instrument Lookup window by pressing the "..." button next to the instrument field. Please see the "Working with Price Data section of the Help Guide for more information on selecting instruments.


Creating_A_Chart_2

tog_minusUnderstanding the chart display

playVideo


Chart Display Overview

Each NinjaTrader chart is a free floating window that can be manually resized by dragging the edges of the window for arrangement within the open Workspace.


The chart image below displays some of the common features you will see inside a NinjaTrader chart window:


1. Right mouse click context menu

Access to all chart features

2. Chart display area

Main display area of a chart where all chart objects (Data Series, Indicators and Drawing Tools) are plotted.

3. Data Series and Indicator panels

More information on panels here.

4. Link button

Window linking links windows to use the same instrument and can be applied to many NinjaTrader windows.

5. Data Series and Indicator labels

Displays the Data Series or Indicator label followed by the applied period and parameters in the upper left hand corner of the chart display area. The Label is an adjustable parameter within the Data Series and Indicators windows.

6. Chart tool bar

Access to chart features. Can be enabled or disabled via chart properties.

7. Price markers

Displays current price and indicator values in the left or right scale. Can be enabled or disabled on a per chart object basis through the Data Series or Indicators window. Drawing tool objects do not have price markers.

8. Caption

Displays the chart Data Series, interval and date at the top of the chart window. The Data Series caption can be edited via the Label parameter in the Data Series window.

9. Horizontal scroll bar

Scrolls the horizontal axis left and right. (See the "Navigating a Chart" section of the Help Guide for more information.) Can be enabled or disabled via chart properties.


Creating_A_Chart_1