|
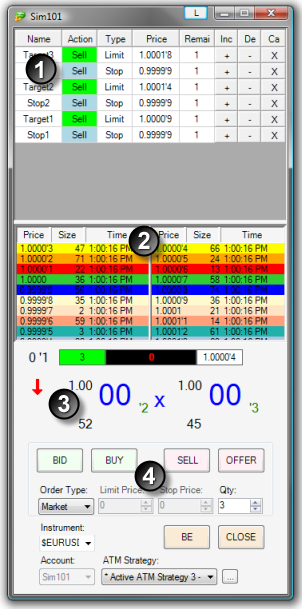
The FX Pro order entry window is comprised of several components designed to give the Forex trader every advantage.
The image below shows each of the four sections in the FX Pro window:
| 2. | Optional Level II panel that is displayed *only* for brokerages that support ECN style FX trading. If your brokerage does not support ECN FX then you will not see this panel on your FX Pro window. |
| 3. | Position and level 1 (current inside market) display |
| 4. | Order entry and ATM Strategy management |
* If your FX provider supports sub pip display you must enable sub pip support via the Misc tab. The various brokerage technology connection guides will state clearly if the brokerage technology offers sub pip support.
Please see the sections below for more information on: Order Grid display, Level II, and Market Display.
|
Order Grid Display
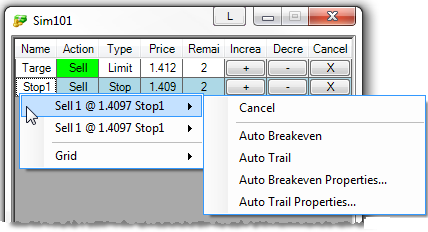
The Order Grid display represents orders in a consolidated format. Orders of the same price, type, and function (entry, Stop Loss, Profit Target) are grouped together and displayed in one row.
Column Definitions
Name
|
Order name such as Stop1 or Target1
|
Action
|
Buy or Sell
|
Type
|
Order type
|
Price
|
Order price
|
Remaining
|
Number of contracts/shares remaining to be filled
|
Increase (+)
|
Increases the order price
|
Decrease (-)
|
Decreases the order price
|
Cancel (X)
|
Cancels the order(s)
|
By moving your mouse cursor over an order and pressing down on your right mouse button, you will see a context menu listing all individual orders consolidated at the corresponding price and any relevant actions that you can perform on those orders.
|
Level II (Market Depth) Display
The Level II panel displays bid and ask market depth data color coded by price. The Level II display can be enabled/disabled by right mouse clicking inside the Level II display and selecting the menu item .
Column Definitions
Price
|
The bid or ask price. The bid data is shown in the left section and the ask in the right.
|
Size
|
The number of lots at that price level available for buy or sell (represented in short hand notation where M represents 1,000,000)
|
Time
|
The last time the bid/ask was refreshed
|
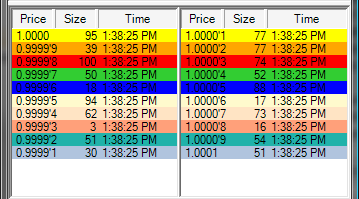
* If a price is at a sub pip level, the sub pip value is displayed as a value after an apostrophe as per the following example where the sub pip is highlighted in red.
Example: 1.4115'5 (The price is at 1.4115 pips plus 5 sub pips which is 5/10 of a pip)
|
Market Display
The Market Display panel shows the inside bid and ask along with current position information.
Market Display Definitions
| 1. | The current spread between the best bid and best ask (the image below is showing a spread of 8 sub pips (8/10 of a pip) |
| 3. | Last tick directional arrow |
| 4. | The handle of the current bid (current ask is on the right side of the blue "X") |
| 6. | Sub pip value, so the current bid is 1.2840 and 3/10 of a pip displayed as 1.2840'3 |
| 7. | Current bid size displayed as 3M (in millions) |
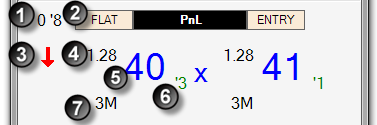
* FX brokerage technologies that do not support an ECN model will NOT display sub pips nor will bid/ask size be displayed.
|
|


