|
<< Click to Display Table of Contents >> Working with Drawing Tools & Objects |


|
Working with Drawing Tools & Objects
|
<< Click to Display Table of Contents >> Working with Drawing Tools & Objects |
|
There are many customizable Drawing Tools and objects available to use in NinjaTrader charts. Drawing Tools can be applied to individual charts or all open charts displaying the same instrument, and templates for each Drawing Tool can be saved to apply commonly used properties in the future.
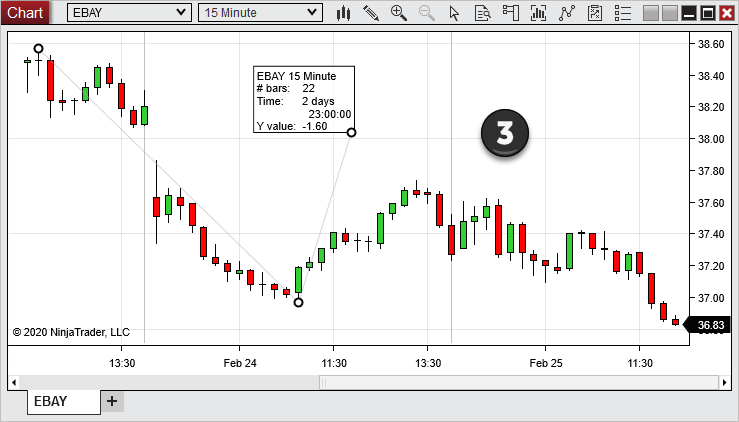
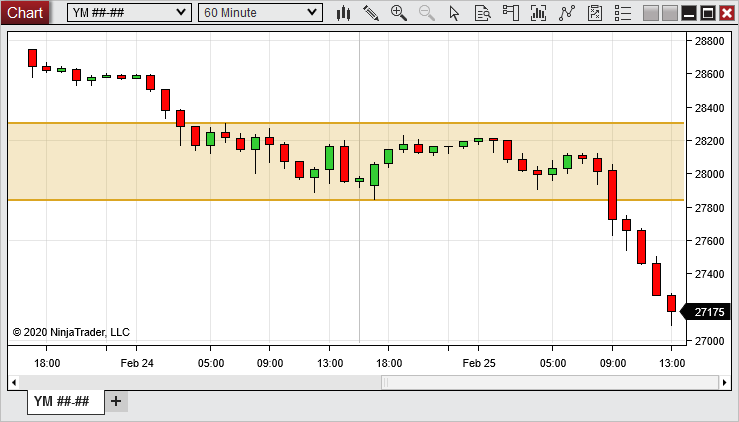
Drawing on a Chart Various Drawing Tools are available and customizable within a chart. The image below shows an example of several Drawing Tools applied to a chart.
|
Ruler |
Ctrl + F3 |
Risk/Reward |
Ctrl + F4 |
Region Highlight X |
Ctrl + F1 |
Region Highlight Y |
Ctrl + F2 |
Line |
F2 |
Ray |
F3 |
Extended Line |
F4 |
Arrow Line |
Ctrl+F2 |
Horizontal Line |
F6 |
Vertical Line |
F7 |
Path |
Ctrl + 4 |
Fibonacci Retracements |
F8 |
Fibonacci Extensions |
F9 |
Fibonacci Time Extensions |
F10 |
Fibonacci Circle |
F11 |
Andrew's Pitchfork |
Ctrl + F8 |
Gann Fan |
Ctrl + F9 |
Regression Channel |
Ctrl + F10 |
Trend Channel |
Ctrl + 2 |
Time Cycles |
Alt + F11 |
Ellipse |
Ctrl + F11 |
Rectangle |
Ctrl+ F12 |
Triangle |
Ctrl + F6 |
Polygon |
Alt + F10 |
Order Flow Volume Profile |
Ctrl + 3 |
Arc |
Ctrl + F7 |
Text |
F12 ( Tip : pressing Alt + Enter while editing the draw text content lets you create line breaks) |
Chart Marker: Arrow Up Arrow Down Diamond Dot Square Triangle Up Triangle Down |
Alt+F2 Alt +F3 Alt +F5 Alt +F6 Alt +F7 Alt +F8 Alt +F9 |
To apply a Drawing Object to a chart, using a Drawing Tool:
1.Select a drawing tool from the Drawing Tools menu. The cursor will change to resemble a pen (Right clicking or pressing the "Esc" key will cancel the operation).
2.Left mouse click on the chart where you wish to set the first anchor point.
3.Left mouse click again on the chart for any other necessary anchor points. Once all anchor points are set, the cursor will change back to the cursor type you had previously selected.
Once the Drawing Object is applied to the chart, it can be selected by left mouse clicking on it. Once selected, the object can be moved throughout the chart, and the anchor points can be moved by left mouse clicking and dragging to a new location.
Snap ModeDrawing Objects can be attached to price and/or time data within the chart by using any of the Snap Mode options available in the Drawing Tools menu:
|
![]() Understanding drawing object properties
Understanding drawing object properties
Each Drawing Tool can be customized using the Drawing Objects window.
Accessing the Drawing Object PropertiesTo access the Drawing Objects dialogue:
1.Left mouse click on a drawing object to select it (once selected, the anchor points will be visible). 2.Either double left mouse click on the drawing object, or right mouse click and select the Properties menu item.
The Drawing Objects dialogue is also accessible directly from the Drawing Tools menu on the chart toolbar, or by right mouse clicking in a chart, then selecting the Drawing Tools menu item.
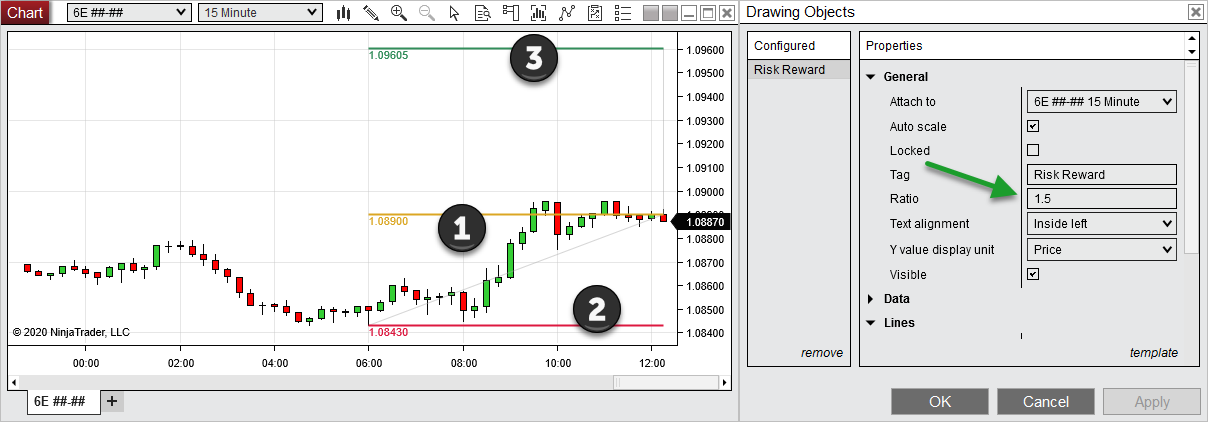
Drawing Object Properties MenuProperties vary between drawing objects. There are common properties, as shown in the image below, and there are also specific properties depending on the type of Drawing Object.
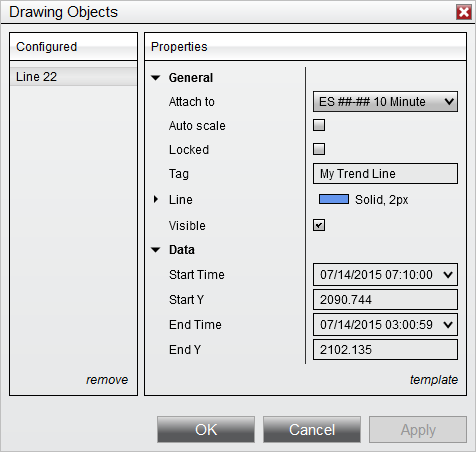
The general properties of the drawing object are located in the General section. The image below shows the General section properties for all Drawing Objects, as well as addition properties unique to the Line Drawing Object.
The properties listed below are included for all Drawing Tools, in addition to each tool's unique properties:
The Data section displays the data locations of the Drawing Object anchor points in the chart. These fields can be modified to change the location of the Drawing Object within the chart. Some drawing tools will include additional properties in the Data section, and some may include variations of the following properties:
|
![]() Understanding Drawing Object templates
Understanding Drawing Object templates
Drawing Object properties can be saved as a template, allowing you to quickly apply those settings to a new Drawing Object of the same type in the future.
What is SavedThe following properties are saved in the General section:
•Auto scale •Color •Dash Style •Width
Attach to will default to the Data Series on which the object is drawn. Tag will be automatically updated for each new drawing object. Locked will default to False. Visible will default to True. Properties within the Data section will NOT be saved.
Saving Drawing Object TemplatesTo save Drawing Object settings:
1.Open the Drawing Object Properties window by either double left mouse clicking on the drawing object or right mouse clicking and selecting Properties. 2.Set desired parameters 3.Left mouse click on the template text located in the bottom right of the Properties dialog. Selecting save will open the Save window, in which you can enter a name for a new template, select an existing template to overwrite it or could click Save as default to save your settings as the new default applied settings for that drawing object. 4.Click the Save / Save as Default button when finished
If you wish to load a previously saved template, you can select the load option after left mouse clicking on the template text. If you change your settings and later wish to go back to the original settings, you can left mouse click on the template text and select the reset option.
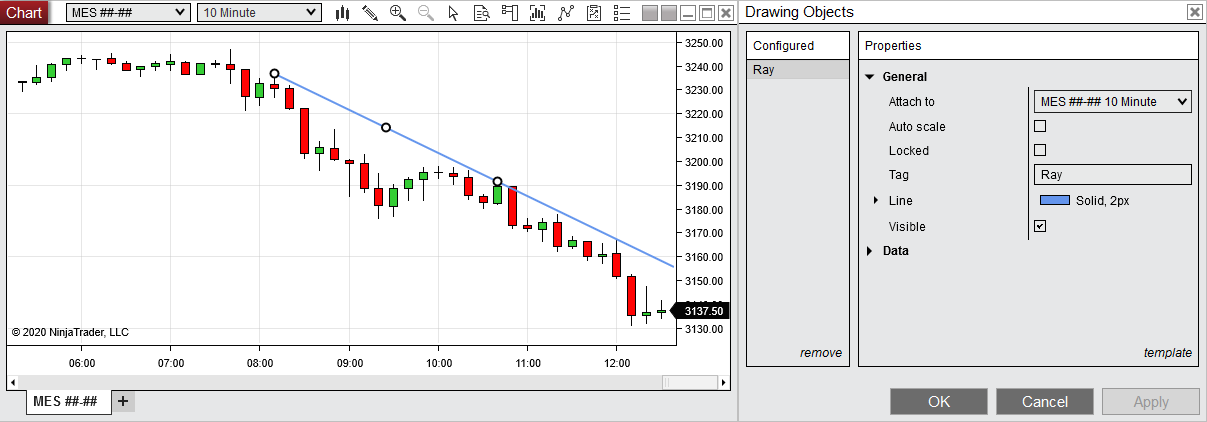
In the image below, a template will be saved for the Ray drawing tool.
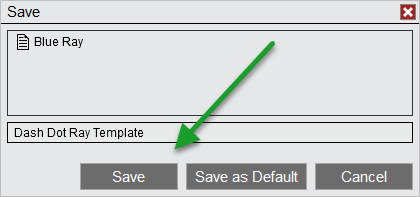
In the image below, we can enter a name for the new Ray template and save it for future use.
Loading a Drawing Object TemplateA Drawing Object template that was previously saved can be applied to any Drawing Object of the same type. For example, a template for the Fibonacci Extensions tool can be applied to a Fibonacci Extensions Drawing Object, but not to a Line Drawing Object.
To load a Drawing Object template:
1.Left mouse click on the template text, then select the load option. 2.The Load window will appear. Select the template to load from the list of templates, then press the Load button.
Removing a Drawing Object TemplateTo remove a Drawing Object template from the list of saved templates:
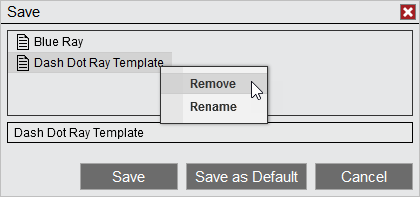
3.Left mouse click on the template text, then select either the Save or Load menu items 1.The Save or Load window will appear, depending on which menu item you selected. Right mouse click the template for removal from the list of templates, then select the Remove menu item.
Renaming a Drawing Object TemplateTo rename a Drawing Object template from the list of saved templates:
4.Left mouse click on the template text, then select either the Save or Load menu items 2.The Save or Load window will appear, depending on which menu item you selected. Right mouse click the existing template in the list, then select the Rename menu item.
In the image below, we can either remove or rename the selected Drawing Object template.
|
Removing Drawing Objects To remove a single Drawing Object:
1.Left mouse click on the Drawing Object to select it (when selected, the anchor points will appear) 2.Press the Delete key on the keyboard or right mouse click on the drawing object and select the Remove menu item
To remove multiple Drawing Objects at the same time:
1.Select the Drawing Tools menu via right mouse clicking in chart or via left mouse clicking the Drawing Tools icon in the chart toolbar 2.Left mouse click on the Remove All Drawing Objects menu item, and dialogue box will appear to confirm that you wish to remove all drawing object. 3.Click the Yes button to confirm
|
![]() Understanding local vs. global drawing objects
Understanding local vs. global drawing objects
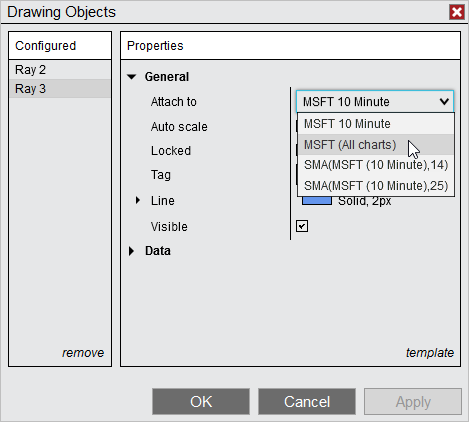
Drawing Objects can be applied to a specific chart (local), or to all charts of the same instrument (global). How to Enable a Global Drawing ObjectTo enable a Global Drawing Object:
1.Apply a Drawing Object to the chart (see the "How to draw on chart" section above) 2.Access the Drawing Object's properties from the Drawing Objects dialogue (see the "Understanding drawing object properties" section above) 3.Locate the "Attach to" drop down menu and select "Instrument name" (All charts)
The Drawing Object will now be applied to all charts for that specific instrument as well as any new charts opened for that instrument. Global Drawing Objects are stored even when a chart of the instrument is not open.
|
![]() Understanding drawing object levels
Understanding drawing object levels
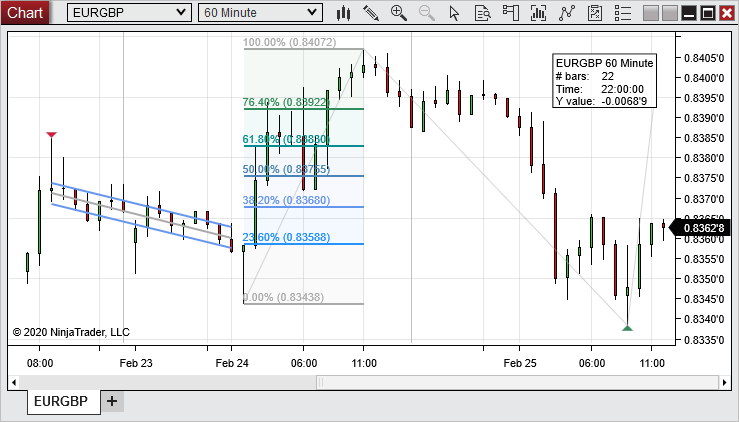
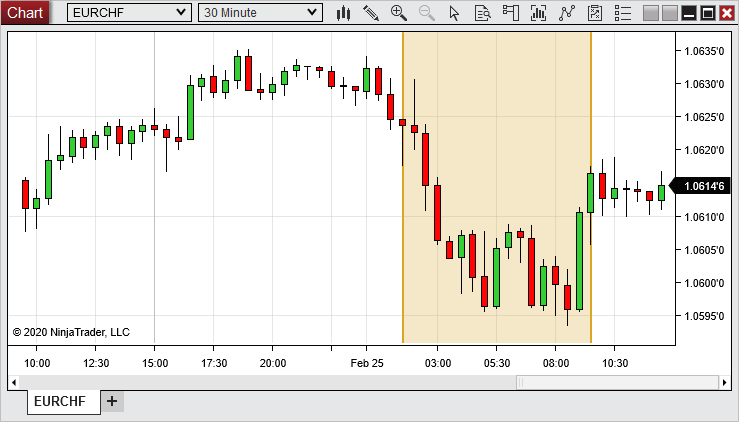
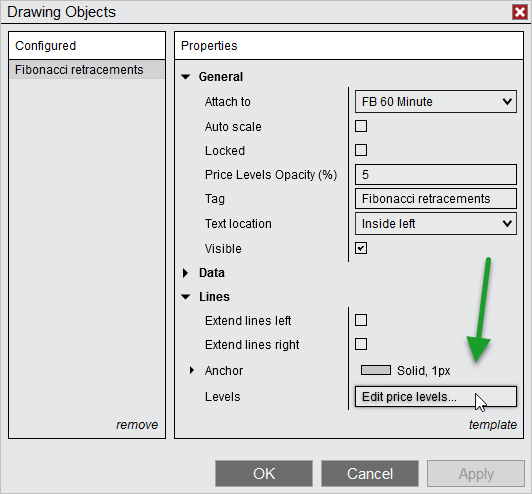
Drawing Object LevelsDrawing Tools that include lines drawn at multiple, customizable price levels, such as Fibonacci Retracements, include a "Levels" property which can be used to add, remove, or edit levels displayed in objects drawn with that Drawing Tool.
The following Drawing Tools include a "Levels" property in the Drawing Objects dialogue:
•Fibonacci Retracements •Fibonacci Extensions •Fibonacci Time Extensions •Fibonacci Circle •Andrew's Pitchfork •Trend Channel
Managing Drawing Object LevelsTo add, remove, or edit levels, first left mouse click on a Drawing Object to select it, then either double-left mouse click the Drawing Object, or right mouse click it and select the Properties menu item to open the Drawing Objects dialogue. The Levels field will display the number of levels currently applied. Left mouse click within this field to open the Levels dialogue, in which you can manage the levels applied to that object.
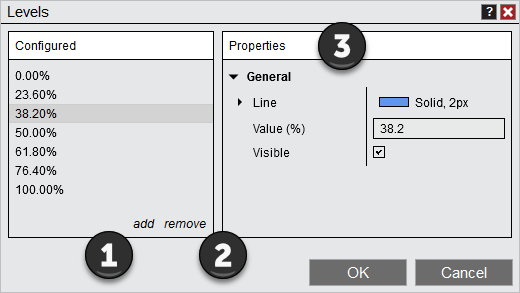
Adding Drawing Object LevelsIn the Levels dialogue, click the add option to add a new price level. A new level will be added to the bottom of the list in the "Configured" section, and will be automatically selected for editing. You can then customize the new level's line color, dash style, width and value (in percent) the "Properties" section. You can also enable or disable visibility of the level in this section.
Removing Drawing Object LevelsTo remove a level from within the Levels dialogue, first select the level you wish to remove from the list, then select the remove option.
Editing Drawing Object LevelsTo edit an existing level from within the Levels dialogue, first select the level you wish to edit, then change any of the properties for that level in the Properties section. When all properties are set to your desired values, click the OK button to save the changes and close the window.
1. Add new price levels with the add option 2. Remove existing price levels with the remove option 3. Edit properties for new or existing levels in the Properties section |