Announcement

Collapse
No announcement yet.

Partner 728x90

Collapse

Ohlc

Collapse
X
 
  • Filter
  • Time
  • Show
Clear All
new posts

    Ohlc

    Hello All,

    anyone has an indicator that would show what was first after the bar`s Open:

    High or Low,or Low then High.

    Would be great if it`s signaling or placing markers somehow.

    Cheers!
    Last edited by outsource; 04-07-2015, 12:20 AM.

    #2
    Hello Outsource,

    Thank you for your post.

    I am not aware of anyone available but I will leave this thread open for any of our other users to respond with anything they may have.

    Let me know if I can be of further assistance.
    Cal H.NinjaTrader Customer Service

    Comment


      #3
      The anaCurrentDayOHLV43 indicator (included with the SessionPivots package in the download section) draws Fibonacci retracements.

      When the high comes first and the low second, the Fibonacci retracements are drawn from the bottom to the top (larger retracement levels above smaller retracement levels).

      When the low comes first and the high second, the Fibonacci retracements are drawn from the top to the bottom (larger retracement levels below smaller retracement levels).
      Attached Files

      Comment


        #4
        Originally posted by Harry View Post
        The anaCurrentDayOHLV43 indicator (included with the SessionPivots package in the download section) draws Fibonacci retracements.

        When the high comes first and the low second, the Fibonacci retracements are drawn from the bottom to the top (larger retracement levels above smaller retracement levels).

        When the low comes first and the high second, the Fibonacci retracements are drawn from the top to the bottom (larger retracement levels below smaller retracement levels).
        Thanks,Harry,

        i didn`t mean the high/low of the day, but a particular bar/candle.high/low don`t matter at all,what matters,is when the price moves first after BAR`S/CANDLES OPEN.

        Comment


          #5
          Originally posted by outsource View Post
          Thanks,Harry,

          i didn`t mean the high/low of the day, but a particular bar/candle.high/low don`t matter at all,what matters,is when the price moves first after BAR`S/CANDLES OPEN.
          This information is not available from the candle itself. You would need to code an indicator that loads secondary bar series of 1-tick data, and then prints that information.

          It is easier to change the timeframe of your chart to a higher resolution then coding such an indicator.

          Comment


            #6
            Originally posted by Harry View Post
            This information is not available from the candle itself. You would need to code an indicator that loads secondary bar series of 1-tick data, and then prints that information.

            It is easier to change the timeframe of your chart to a higher resolution then coding such an indicator.
            If i used anaCurrentDayOHLV43 COBC = false,would the prior bar be as reference point for the fibs?

            Comment


              #7
              Originally posted by outsource View Post
              If i used anaCurrentDayOHLV43 COBC = false,would the prior bar be as reference point for the fibs?
              Harry,please skip this one,i got it

              The only thing i`d like to ask is,bu default the fibs alternate when new low or new high is made,depending on in what direction the fib is stretched.Is there a way to change logic,from the new high/low to the fibs levels of 0.786 and 0.236?

              Comment


                #8
                Originally posted by outsource View Post
                If i used anaCurrentDayOHLV43 COBC = false,would the prior bar be as reference point for the fibs?
                I am not sure that I understand the question. If you set the indicator to COBC = false, the indicator calculates high and low from all price bars of the current session. This includes the current bar. Fibonacci retracements are shown based on the current high and low.

                If you set the indicator to COBC = true, it will show high and low based on the prior bars until the current bar is completed. Accordingly, fib retracements will be calculated from highs and llows excluding the current bar.

                Comment


                  #9
                  Originally posted by Harry View Post
                  The anaCurrentDayOHLV43 indicator (included with the SessionPivots package in the download section)...
                  Hi Harry, have you updated your metnioned SessionPivots package to NT8 already? I can only find the NT7 version there. Thank you!

                  Comment


                    #10
                    Originally posted by Heart View Post
                    Hi Harry, have you updated your metnioned SessionPivots package to NT8 already? I can only find the NT7 version there. Thank you!
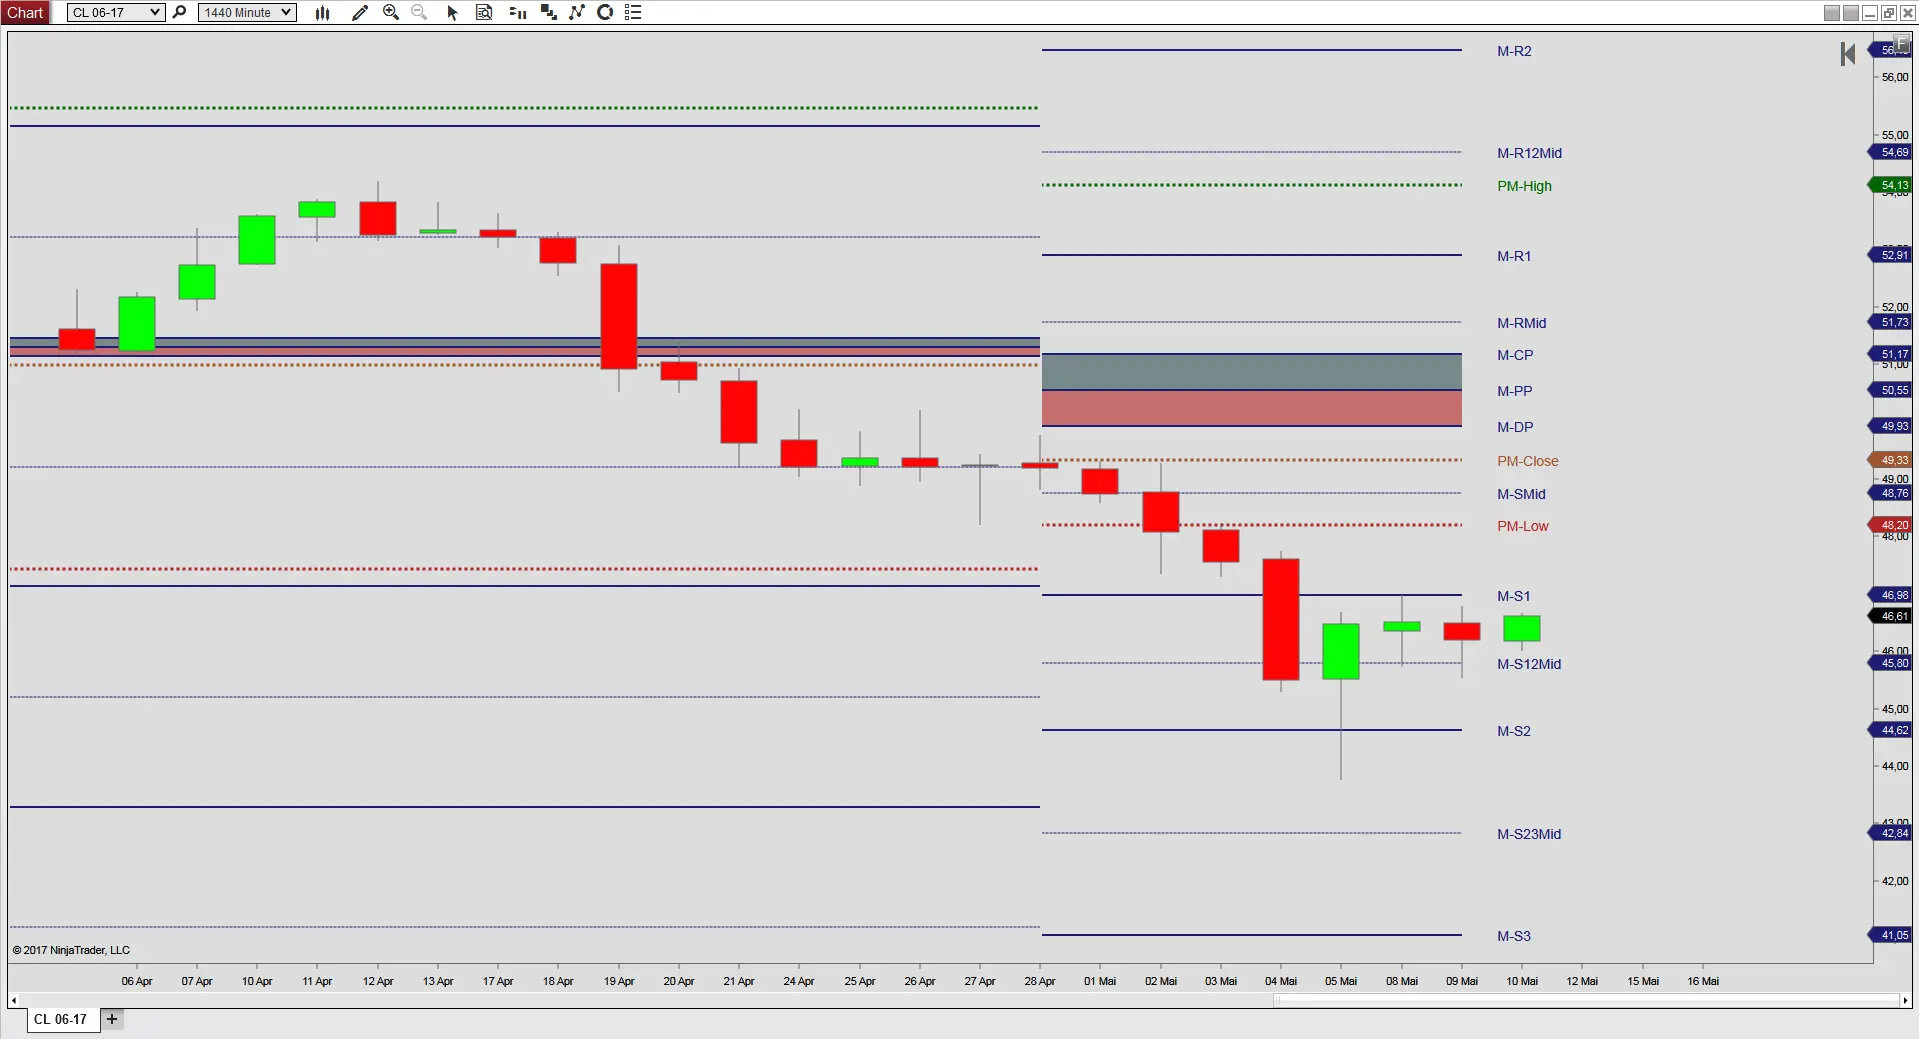
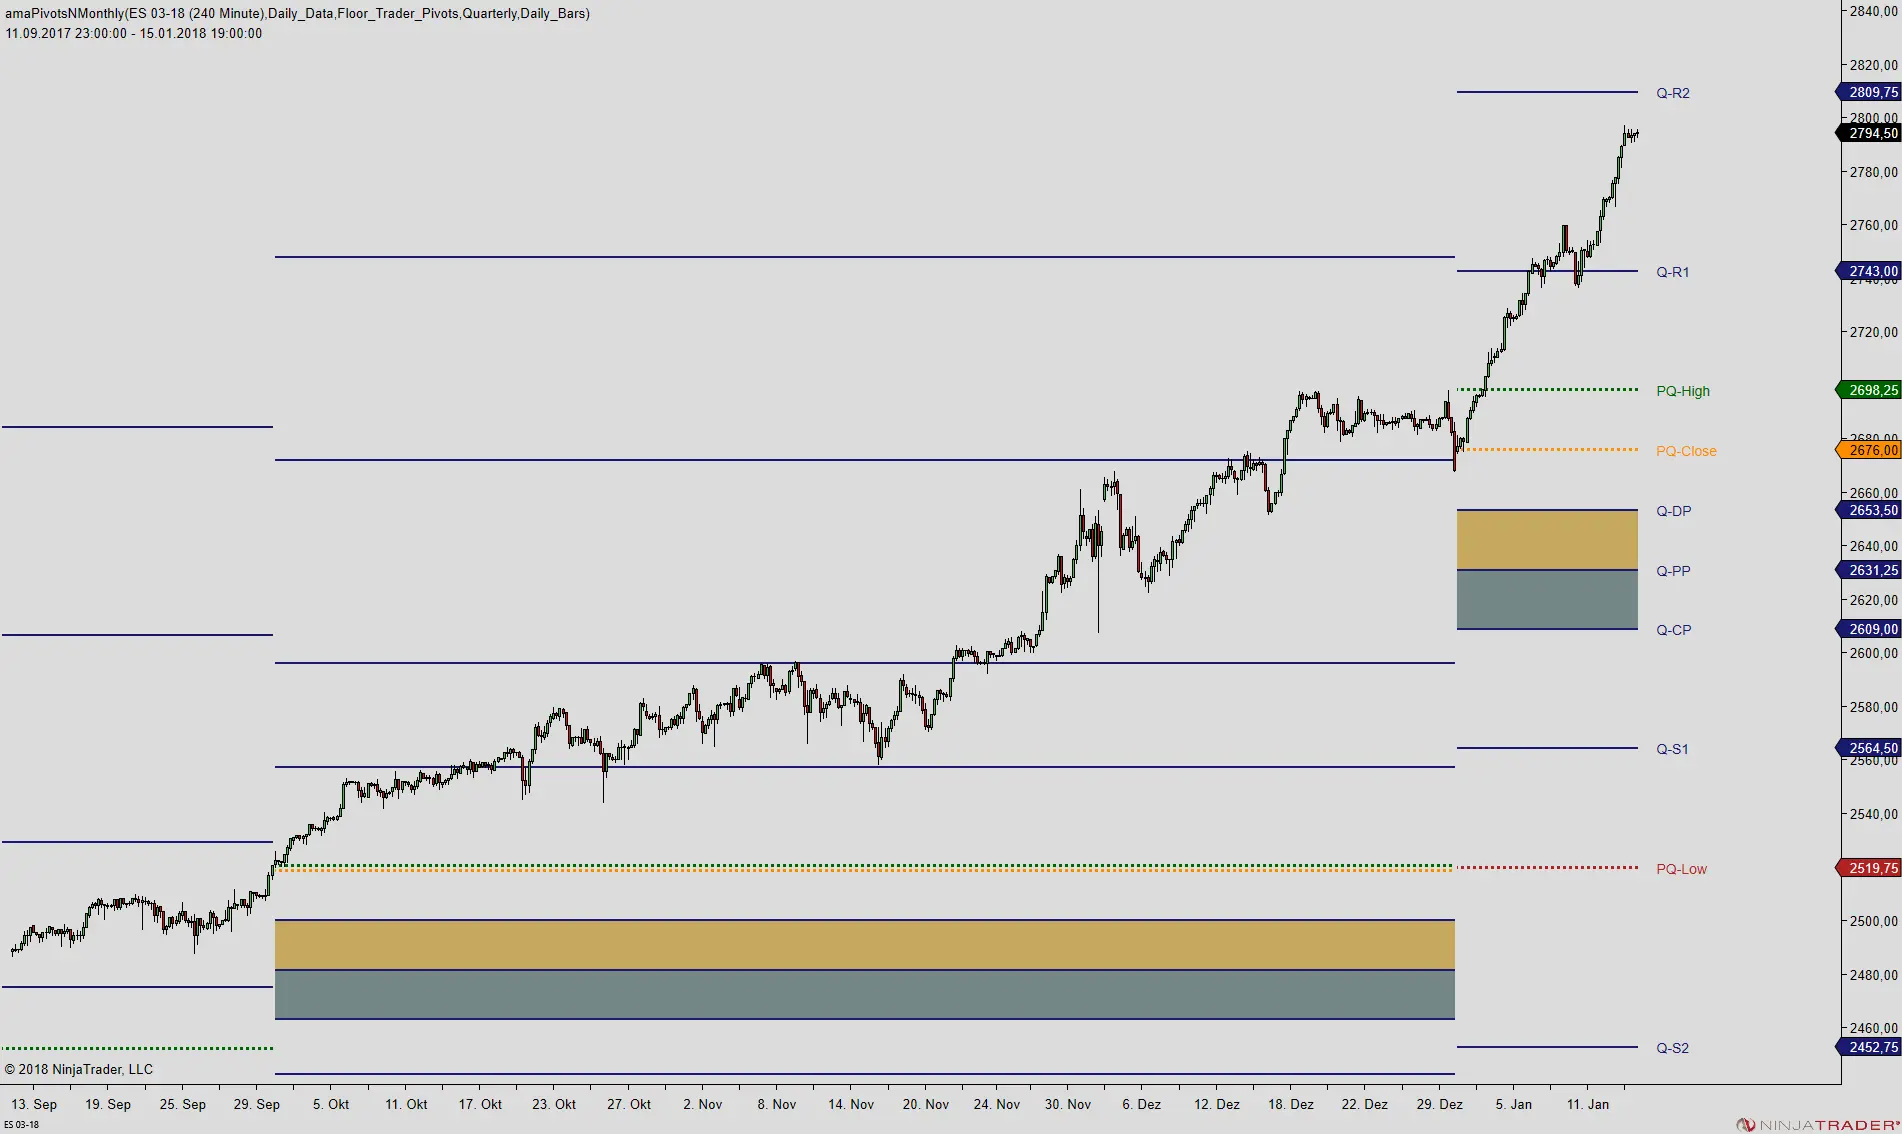
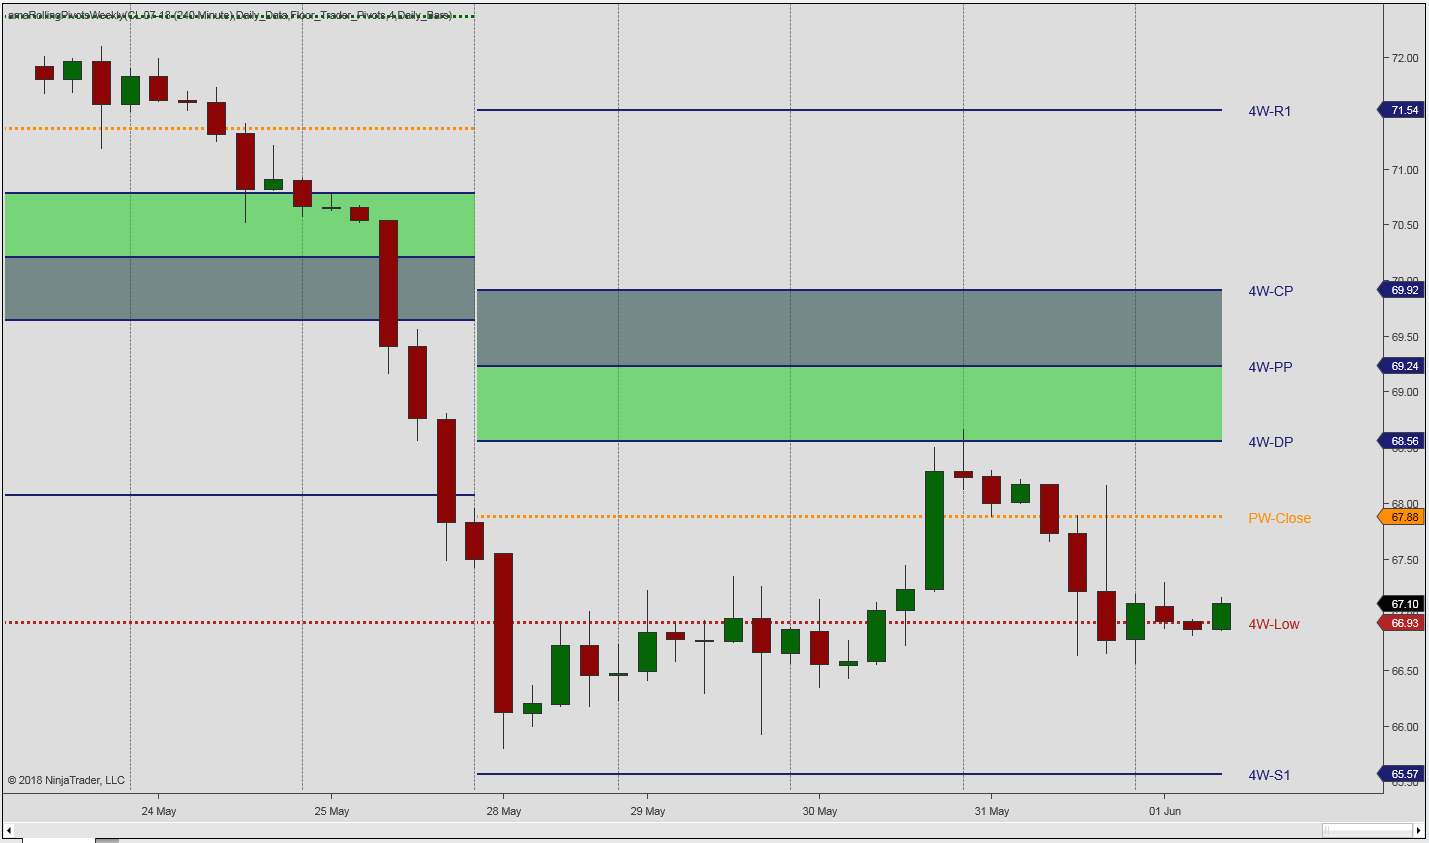
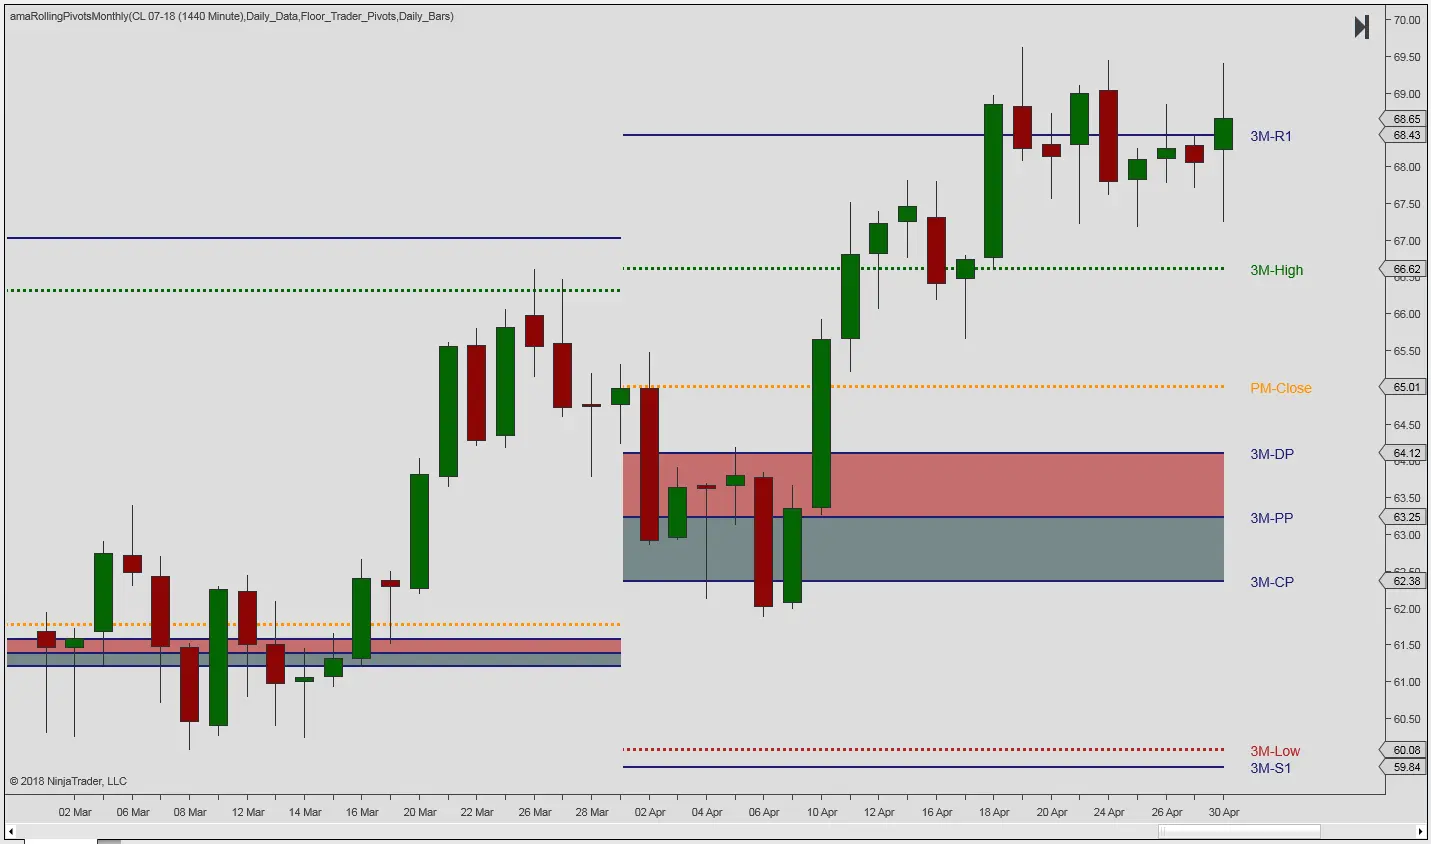
                    The SessionPivots package for NT7 comes with six different indicators. It contains 3 pivot indicators and 3 OHL indicators with fib retracements, noise bands, expansion bands and ADR projections. For NinjaTrader 8 there are now 14 indicators that cover about the same features. You will find the description and indicators here:

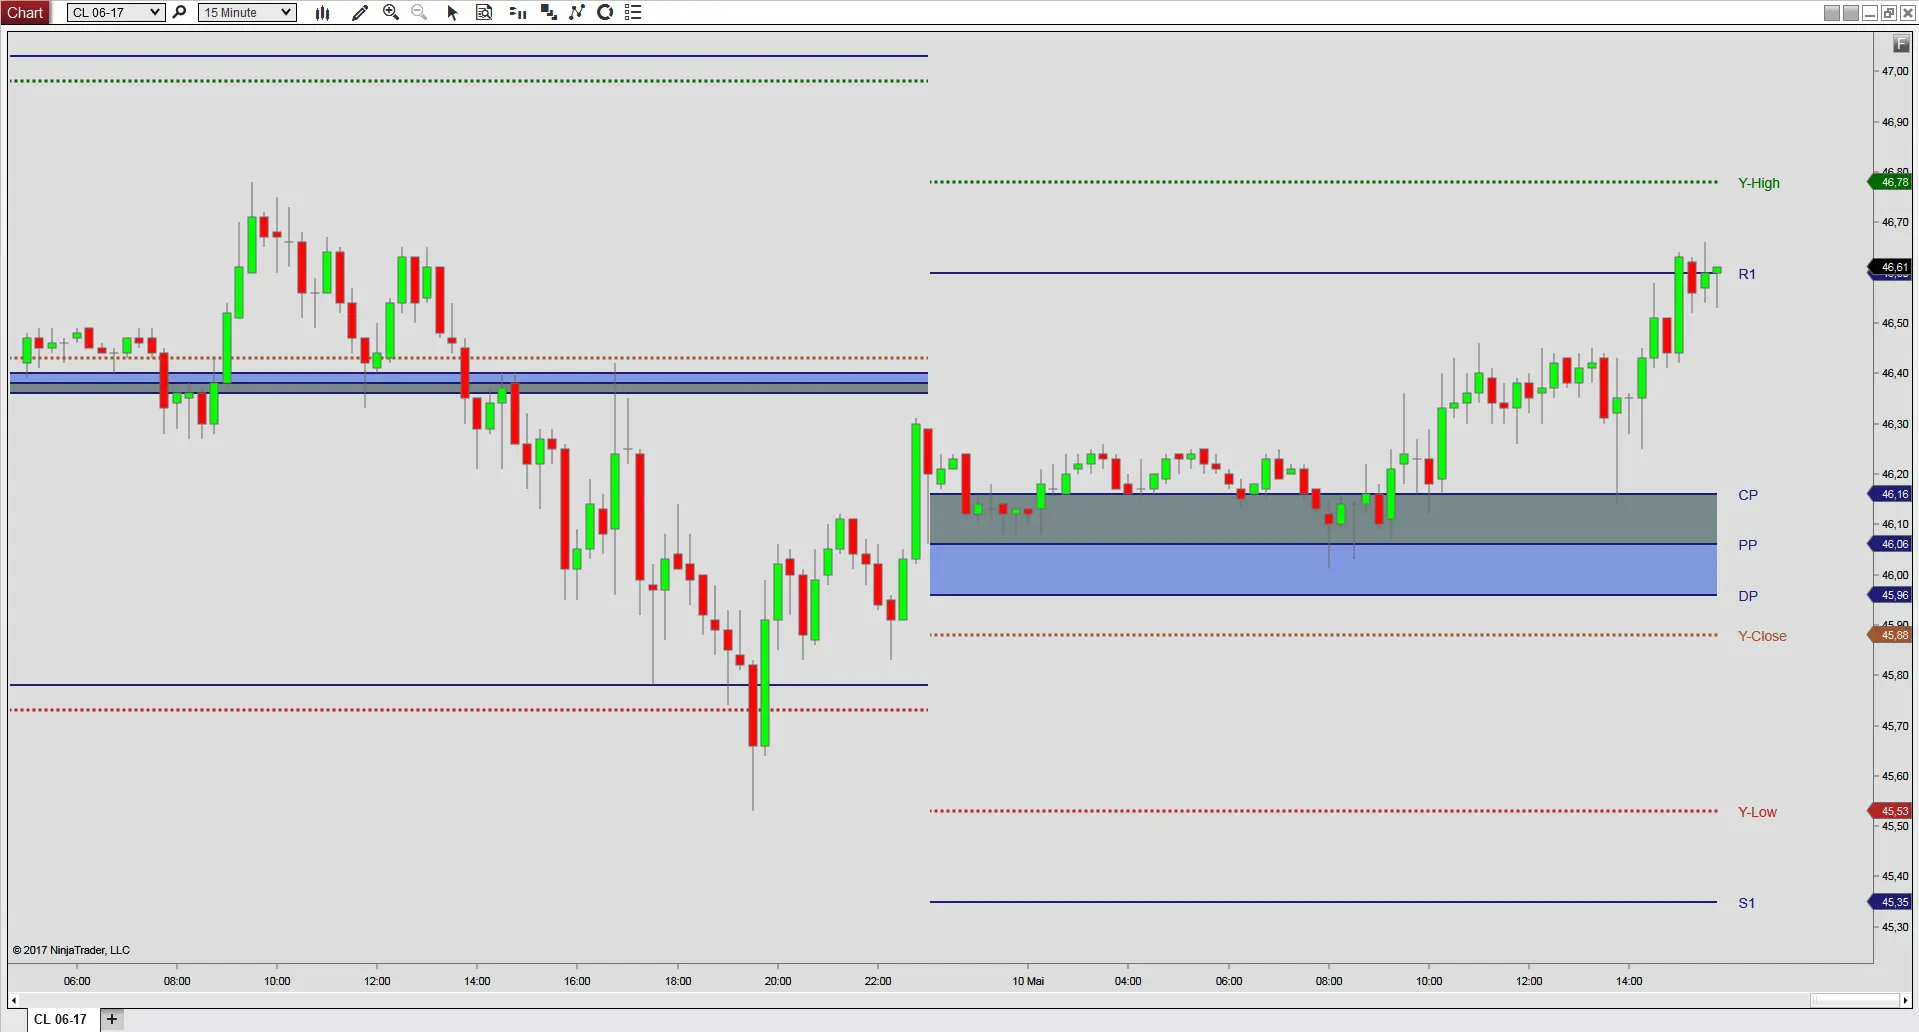
                    Daily pivots are calculated using the high, low and close from the previous day’s session, locating intraday support and resistance points.


                    Monthly pivots are calculated from the high, low and close of the previous month’s session. Our Indicator Library also features Hourly Pivot levels, Daily Pivot Levels, Weekly Pivot levels and N-Montly Pivot levels. The Library Pivot versions can be compared to our Premium Pivot package here.

                    This indicator is used to establish the Yearly Pivot and may also be used to locate Bi-monthly, Quarterly and Semi Annual Pivots


                    The rolling daily pivot was suggested as a trend filter by Mark B. Fisher in his book The Logical Trader. One may also create rolling weekly pivot levels by taking the highest high, lowest low of the past N-weeks and the close/settlement of the current week in order to create rolling weekly pivot levels.

                    The rolling daily pivot was suggested as a trend filter by Mark B. Fisher in his book The Logical Trader. One may also create rolling monthly pivot levels by taking the highest high, lowest low of the past N-months and the close/settlement of the current month in order to create rolling monthly pivot levels.

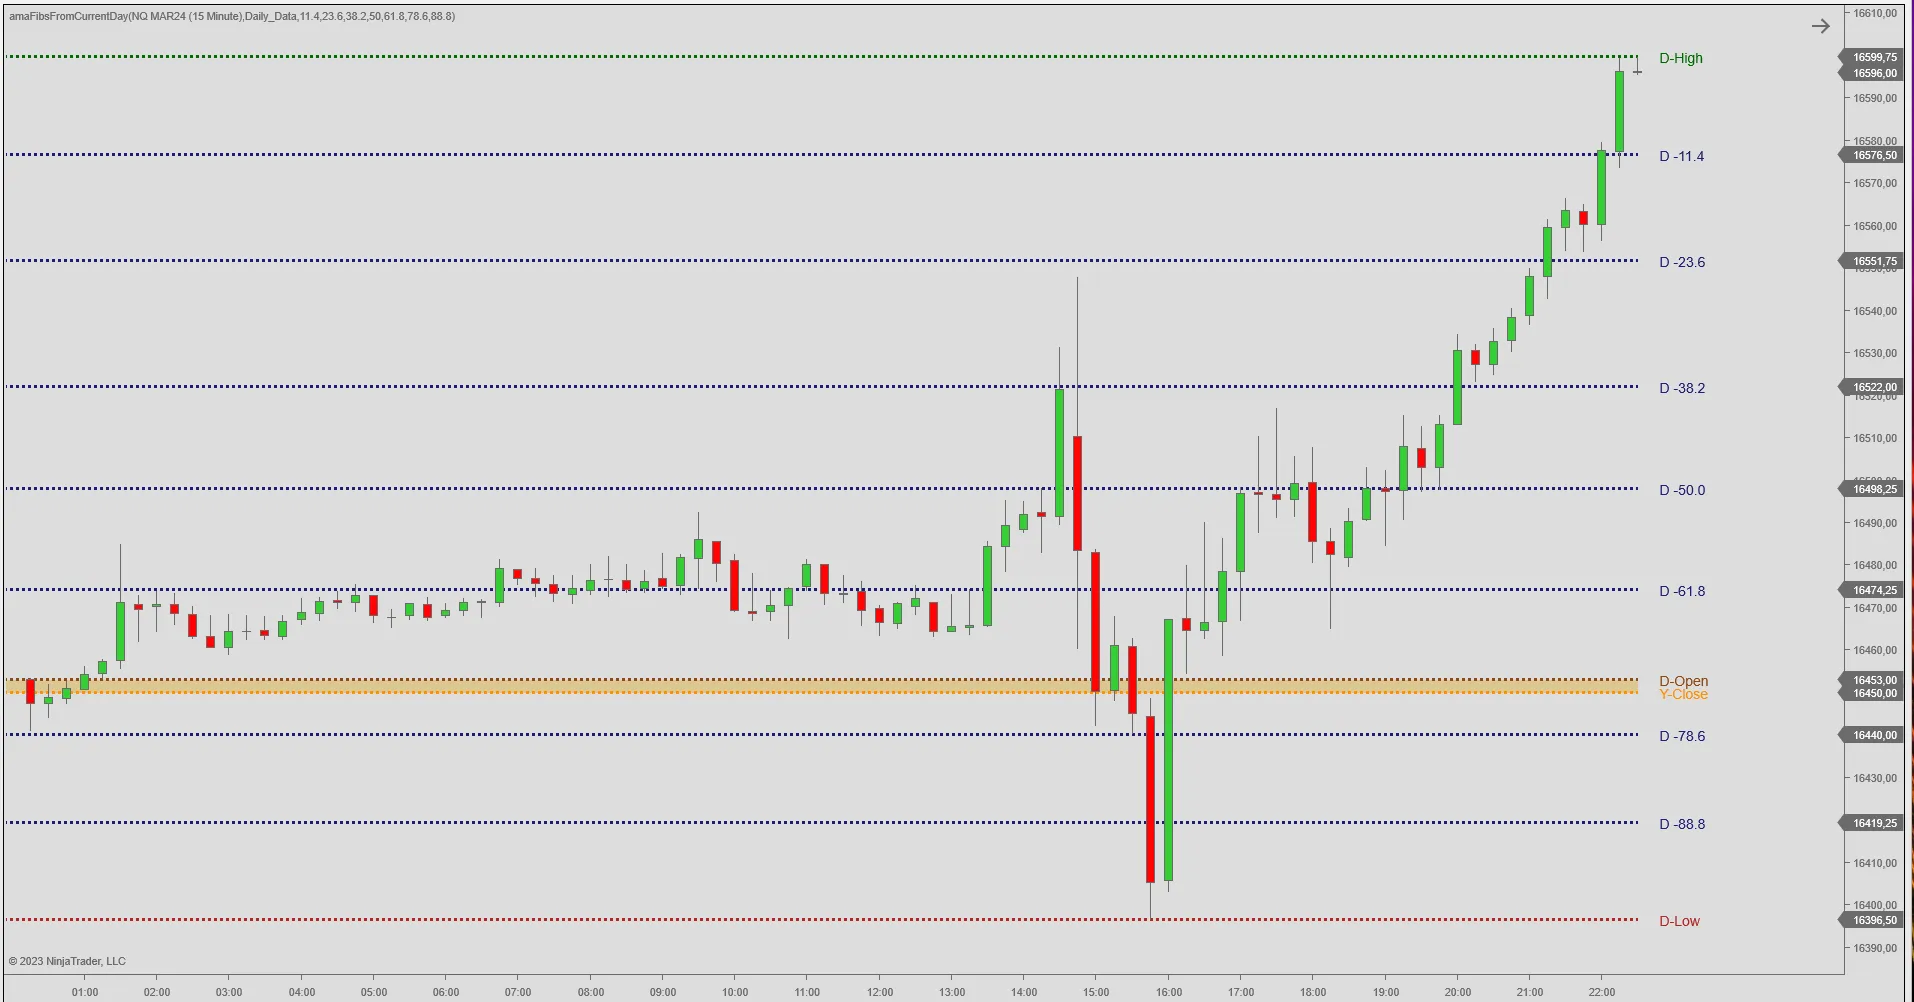
                    The Fibs from Current Day display Fibonacci retracements and expansions calculated from the current day high and low. Other than the below description, you may also review our Indicator Spotlight on the Fibonacci Retracements Levels (with video).

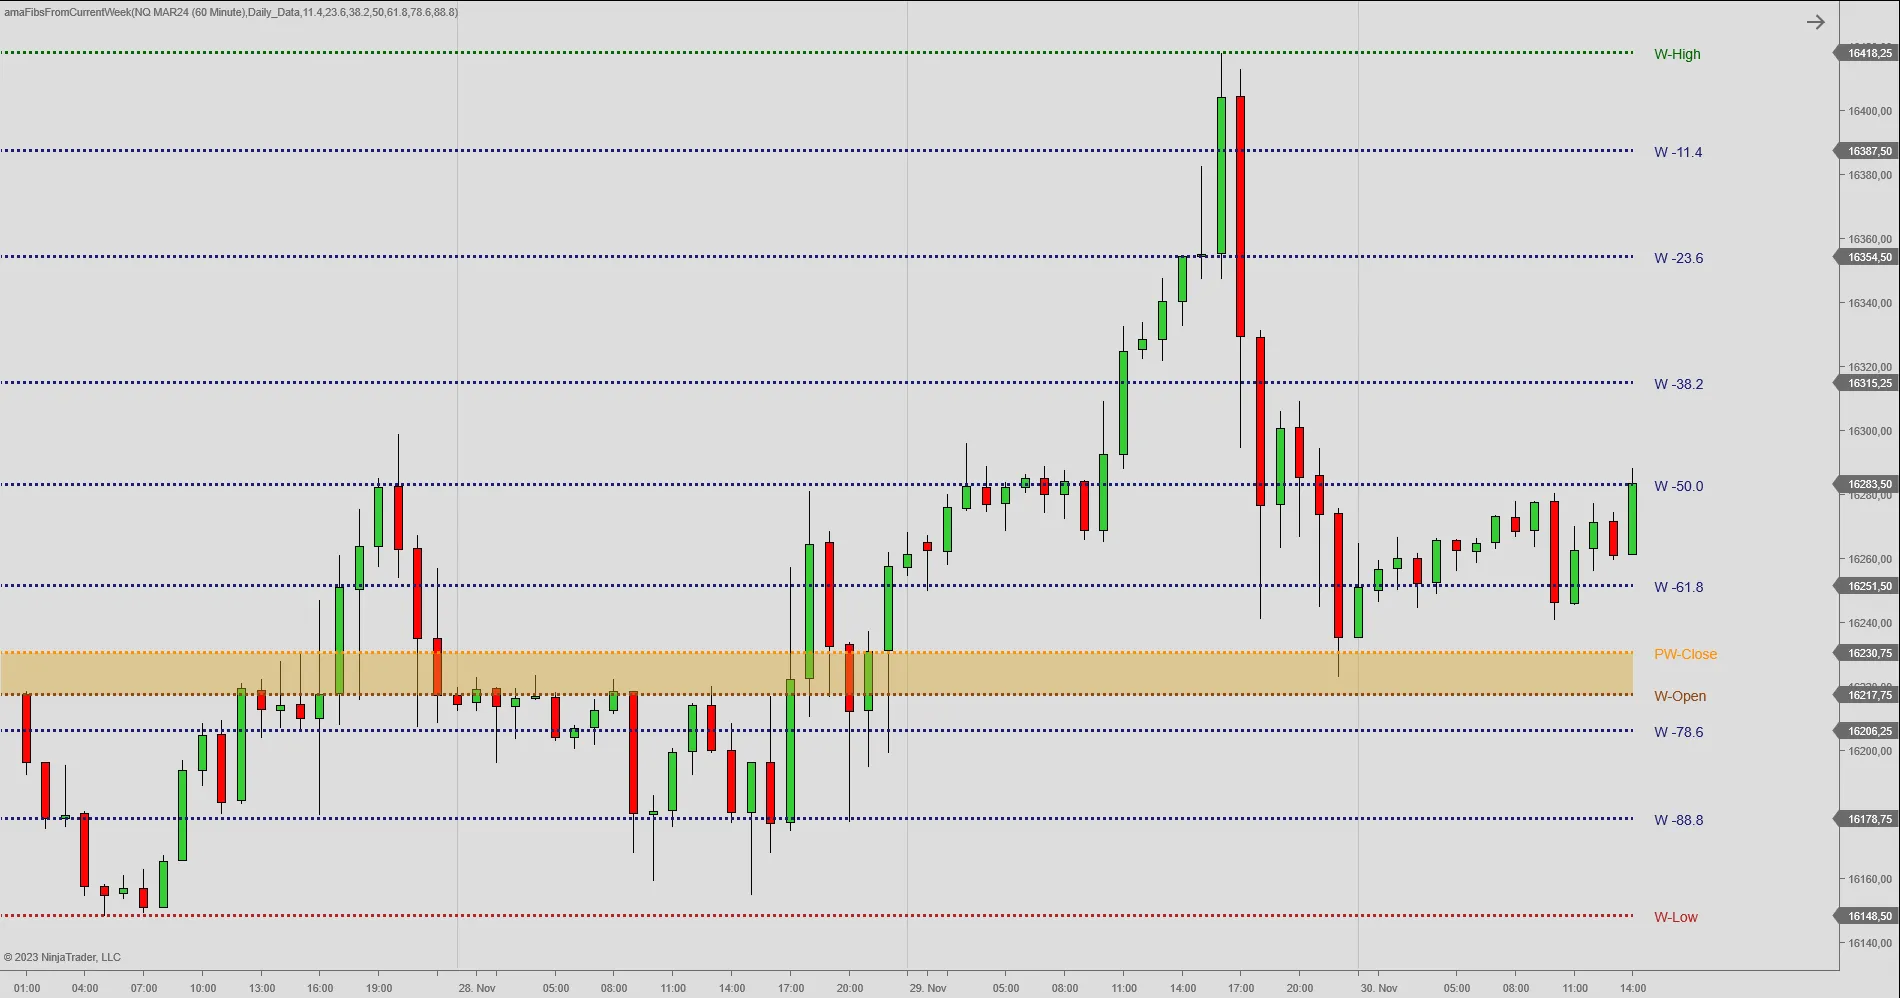
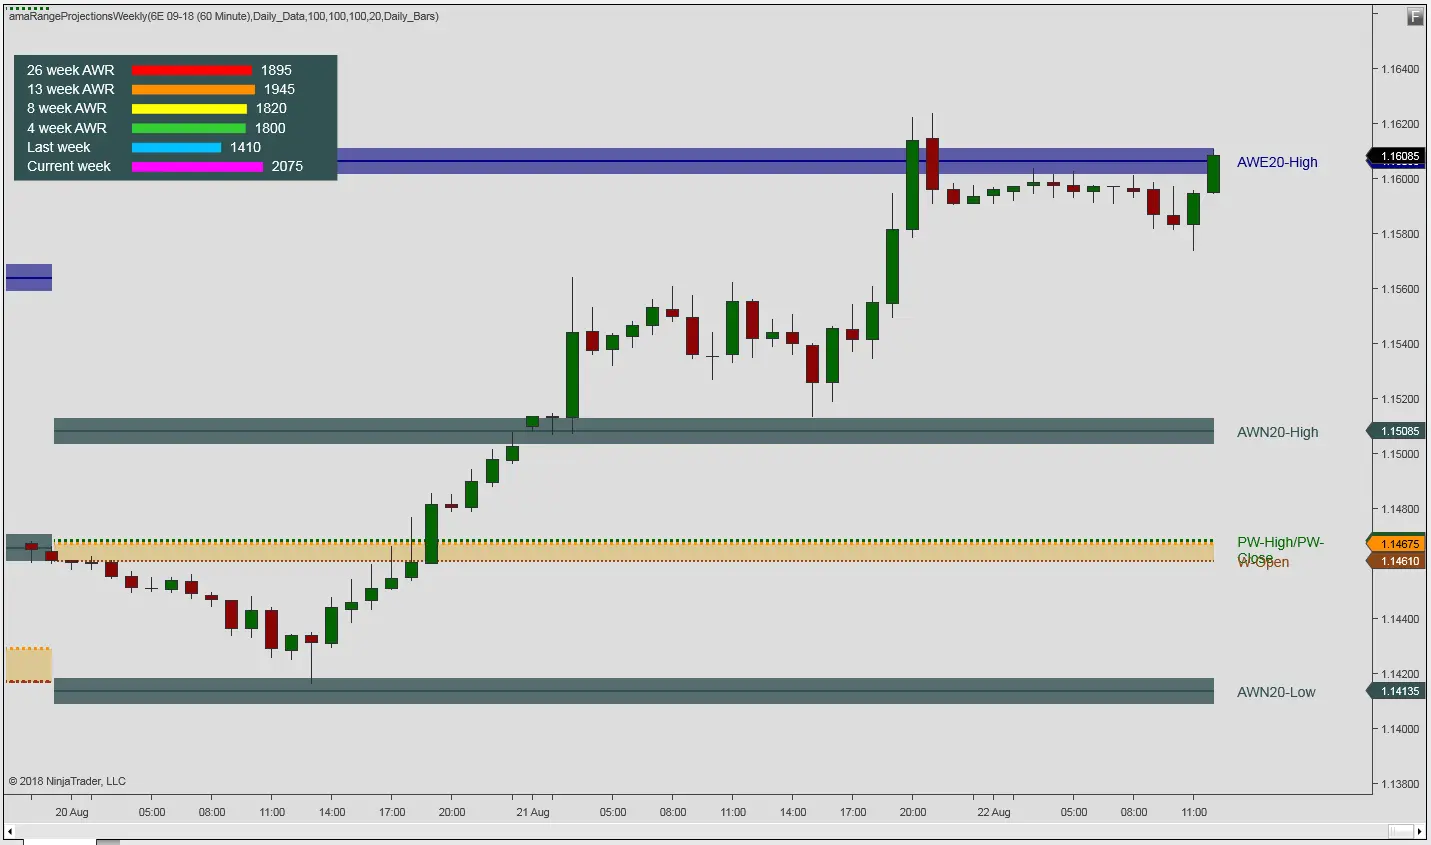
                    The Fibs from Current Week display Fibonacci retracements and expansions calculated from the current week high and low. The high and low points can be measured from daily data or from intraday data. Other than the below description, you may also review our Indicator Spotlight on the Fibonacci Retracement Levels (with video).


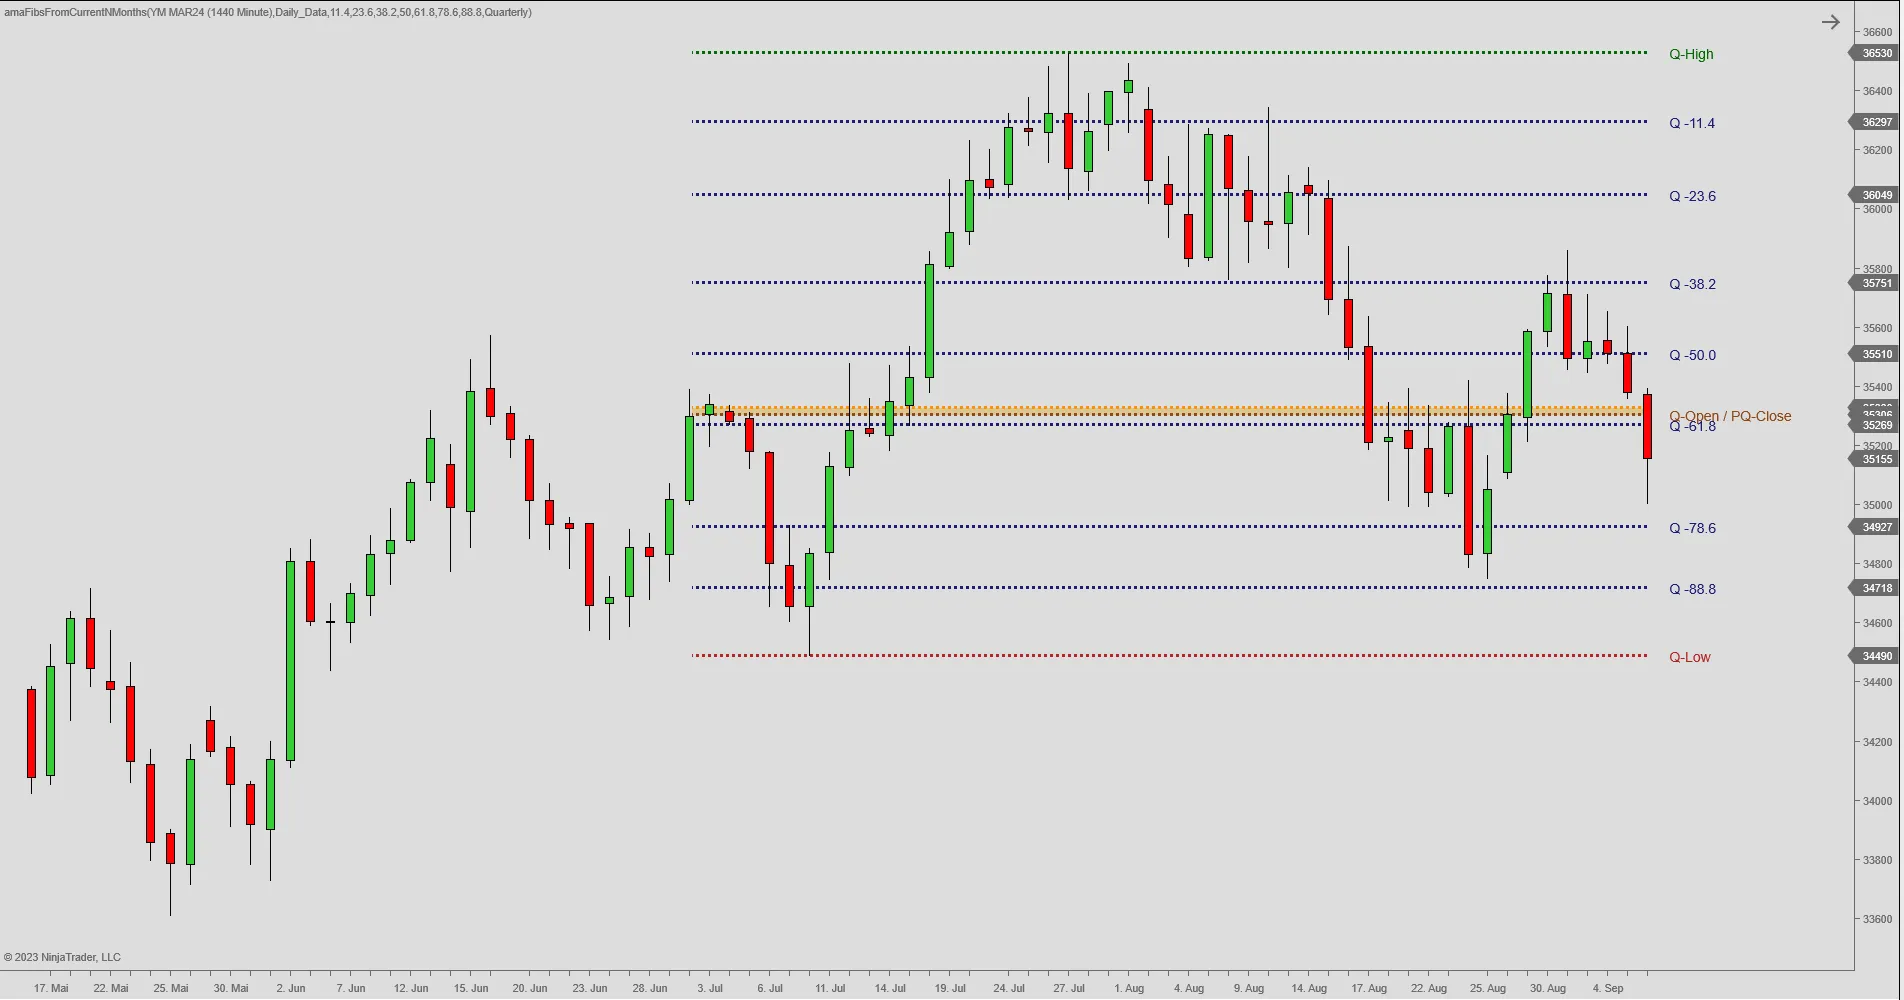
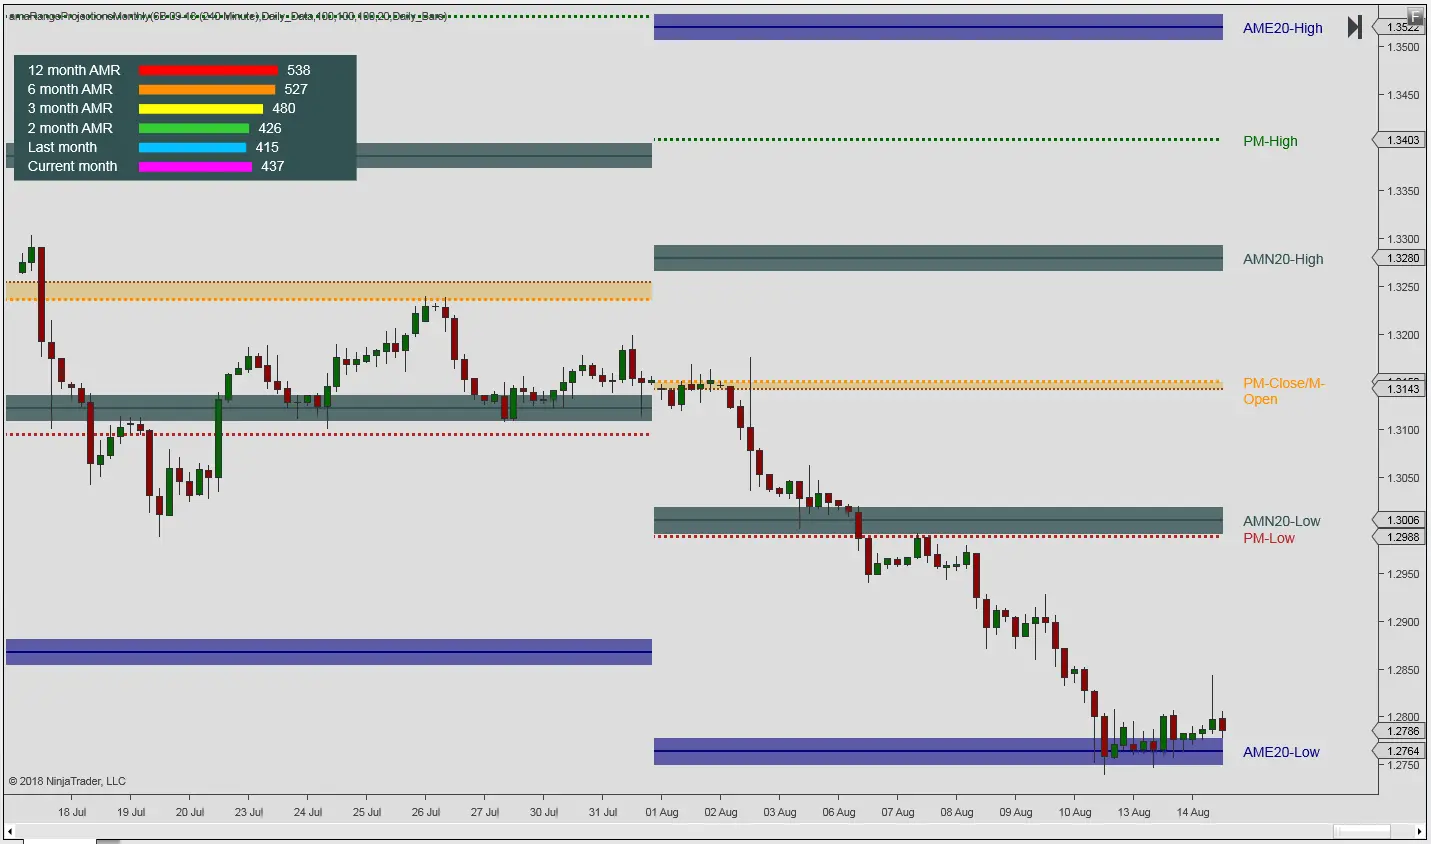
                    The Fibs from the current N Months will display Fibonacci retracements and expansions calculated from the current N months high and low. For example, the indicator can be used to plot yearly fib retracement levels. Furthermore, the high and low points can be measured from daily data or from intraday data. Other than the below description, you may also review our Indicator Spotlight on the Fibonacci Retracement Levels (with video).

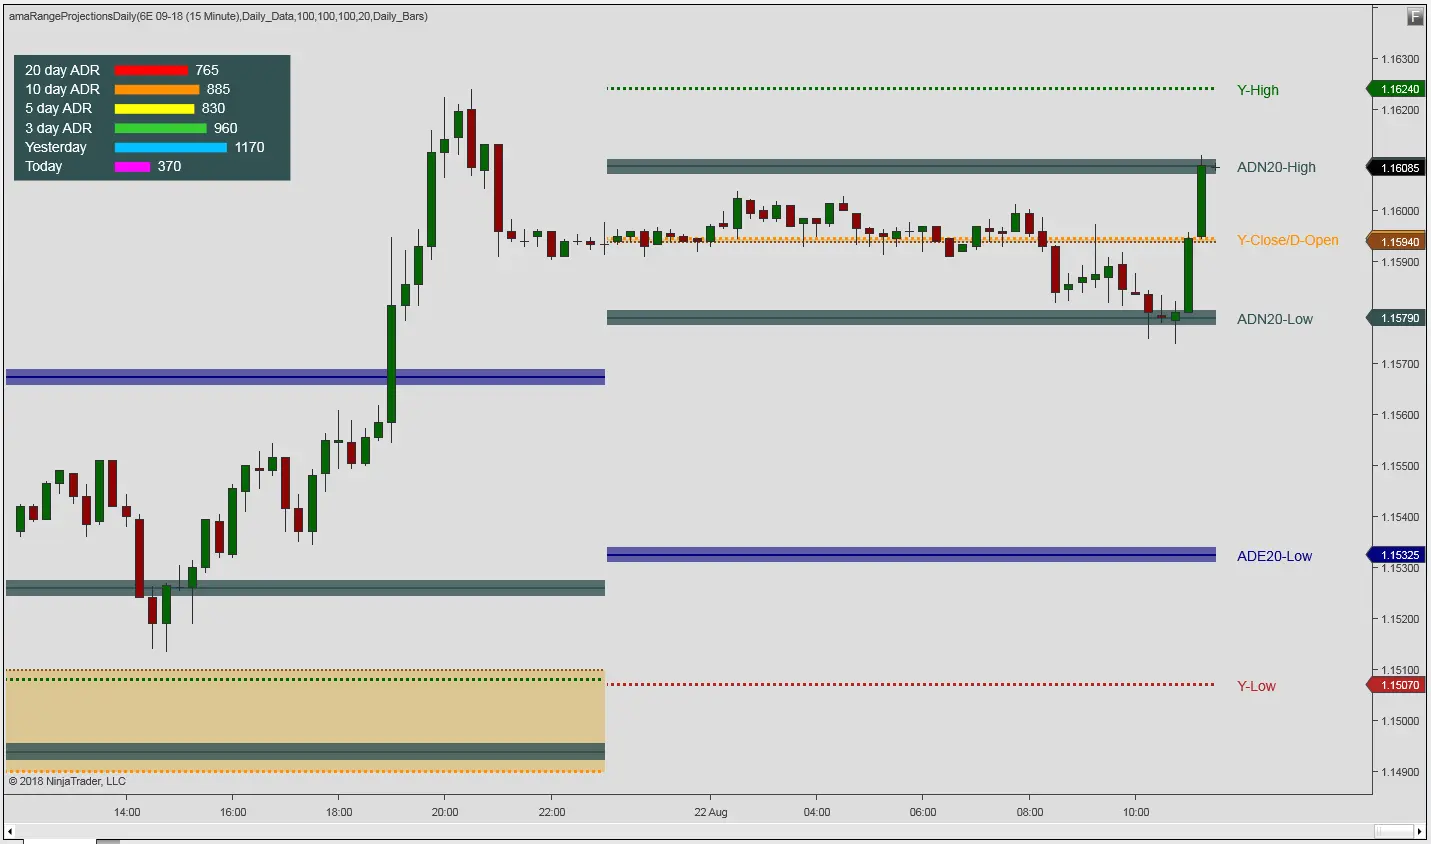
                    The Daily Range Projections indicator displays support and resistance levels based on the volatility of the prior N days. The noise bands show how far noise trader typically drive prices. A breakout from these levels will indicate participation from higher timeframe traders, bringing Range Projections, i.e. profit target bands, into play.

                    The Weekly Range Projections indicator displays support and resistance levels based on the volatility of the prior N weeks. The noise bands show how far noise trader typically drive prices. A breakout from these levels will indicate participation from higher timeframe traders, bringing Range Projections, i.e. profit target bands, into play.

                    The Monthly Range Projections indicator displays support and resistance levels based on the volatility of the prior N months. The noise bands show how far noise trader typically drive prices. A breakout from these levels will indicate participation from higher timeframe traders, bringing Range Projections, i.e. profit target bands, into play.

                    Comment

                    Latest Posts

                    Collapse

                    Topics Statistics Last Post
                    Started by bortz, 11-06-2023, 08:04 AM
                    47 responses
                    1,603 views
                    0 likes
                    Last Post aligator  
                    Started by jaybedreamin, Today, 05:56 PM
                    0 responses
                    8 views
                    0 likes
                    Last Post jaybedreamin  
                    Started by DJ888, 04-16-2024, 06:09 PM
                    6 responses
                    18 views
                    0 likes
                    Last Post DJ888
                    by DJ888
                     
                    Started by Jon17, Today, 04:33 PM
                    0 responses
                    4 views
                    0 likes
                    Last Post Jon17
                    by Jon17
                     
                    Started by Javierw.ok, Today, 04:12 PM
                    0 responses
                    12 views
                    0 likes
                    Last Post Javierw.ok  
                    Working...
                    X