
Howdy.
I have downloaded and used the sample from THIS example.
What I have is essentially a range chart, and this is my primary dataSeries. I have also added a 60 minute dataSeries, and synced it via sma.
Then what I did, was take the Open from the 60 min dataSeries, and then plotted it on the chart to show that I am tracking it. You can see that in the pic below. The red horizontals lines show the Open from the secondary 60min chart.
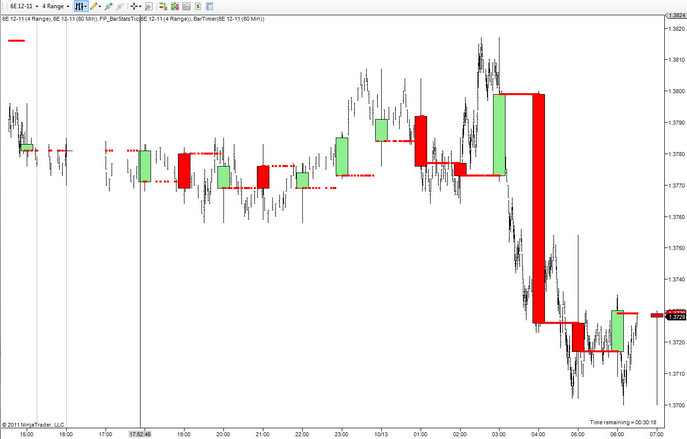
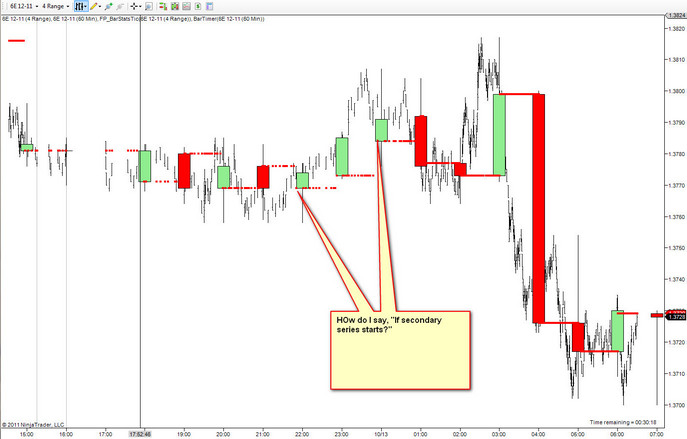
I will have other questions, but my first question is, how do you reference when a new secondary bar starts? I.e. each time a NEW hourly open starts, how do you say, "If secondary series starts again.....?" Here is a visual.
Here is my basic script so far based on the example link I posted above:
I have downloaded and used the sample from THIS example.
What I have is essentially a range chart, and this is my primary dataSeries. I have also added a 60 minute dataSeries, and synced it via sma.
Then what I did, was take the Open from the 60 min dataSeries, and then plotted it on the chart to show that I am tracking it. You can see that in the pic below. The red horizontals lines show the Open from the secondary 60min chart.
I will have other questions, but my first question is, how do you reference when a new secondary bar starts? I.e. each time a NEW hourly open starts, how do you say, "If secondary series starts again.....?" Here is a visual.
Here is my basic script so far based on the example link I posted above:
Code:
        #region Variables
		private DataSeries secondaryOpen;
        #endregion


        protected override void Initialize()
        {
			Add(new Plot(Color.FromKnownColor(KnownColor.Red), PlotStyle.Dot, "Anchor"));

			Add(PeriodType.Minute, 60);

            Overlay				= true;
			CalculateOnBarClose = true;
        }


        protected override void OnBarUpdate()
        {
			if (secondaryOpen == null)
			{
				/* Syncs another DataSeries object to the secondary bar object.
				We use an arbitrary indicator overloaded with an IDataSeries input to achieve the sync.
				The indicator can be any indicator. The DataSeries will be synced to whatever the
				BarsArray[] is provided.*/
				secondaryOpen = new DataSeries(SMA(BarsArray[1], 50));
			}

			// Executed on secondary bar updates only
			if (BarsInProgress == 1)
			{
				// Set the DataSeries object to store the trading range of the secondary bar
				secondaryOpen.Set(Open[0]);
			}

			AnchorLine.Set(secondaryOpen[0]);
        }
Attached Files

Comment