Announcement

Collapse

Looking for a User App or Add-On built by the NinjaTrader community?

Visit NinjaTrader EcoSystem and our free User App Share!

Have a question for the NinjaScript developer community? Open a new thread in our NinjaScript File Sharing Discussion Forum!
See more
See less

Partner 728x90

Collapse

Workarounds and other difficulties

Collapse
X
 
  • Filter
  • Time
  • Show
Clear All
new posts

    Workarounds and other difficulties

    There are several things I would like to do but find difficult, and other things that I feel don't work properly.

    1. BarsRequired: The help section could explain this better. My experiments have shown that BarsRequired is the minimum number of bars with the longest period. What if I want to use a strategy on a 5 minute chart, add an instrument with a daily period of 1, and start the strategy after 30 minutes? I can't do BarsRequired = 6, because then the strategy won't start until the 6th day.

    2. BarsRequired part 2: If I set BarsRequired = 0, I would expect the strategy to run immediately, but that doesn't appear to be the case. In the screen shot below the chart begins on 6/1/2007, but the strategy doesn't start until 6/3/2007.


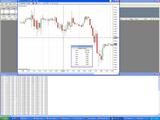
    3. In the same screen shot, the strategy adds a bar with a daily period of 1. Why does accessing Lows[1][0] return a daily high that has not occurred yet? For instance, on 6/4/2007 at midnight the main bar (hourly) prints the daily low, which is the value 12634, but that won't occur until 10:00 AM. From reading the help page on Multi-frame instruments, I would actually expect Lows[1][0] to return the daily low from 6/3/2007.

    4. The difference between historical data and real time data with CalculateOnBarClose = false. It seems to me that this could have been avoided by creating all bars at the same time, as shown below.


    5. Only being able to enter and exits positions on the first bar of an instrument is frustrating. What if I want a 5 minute chart that uses 10 second bars for entry/exit signals? Am I stuck creating a 10 second bar chart and running the strategy on that?

    6. SetStopLoss() and SetProfitTarget(). These aren't explained very well. I would expect that NT calculates the correct buy/sell price and submits the orders which are filled normally. What seems to happen is that when that the price is reached, they are filled but NT assumes that my profit/loss is exactly what I set it to be. For example if I do: SetStopLoss(40.1112) and the protective stop is hit, instead of calculating the exact loss based on order fills NT assumes my loss was 40.1112. See the screen shot below. For 5 YM contracts at 5 points/tick and a loss of two ticks, the actual loss should be 5*5*2 = 50.


    7. SetStopLoss() part 2. Once we call SetStopLoss() are we stuck with it? Is there any way to prevent exits based on it, or do I just have to call the function with a ridiculously high value so that it never executes?

    8. SessionBegin and SessionEnd. Does setting these do anything besides trim the chart and prevent strategy execution for bars outside these ranges? I was hoping it would also trim data so that if I set the session times properly it would automatically filter out after-hours data, but that doesn't appear to be the case. For example I would like to know what the highs and lows are for the YM between 9:30 AM and 4:00 PM.

    9. Clicking on the task bar to bring up a chart doesn't always work. I have to right click, select Maximize. I have this problem when the help window is open as well, clicking on the Control Center tab brings up the help window, which I then have to minimize.

    Thanks for any and all help in advance. I've attached the two strategies I used to generate the screen shots. I ran the strategy on the YM from 6/1/2007 to 6/6/2007, using OpenTick.
    Attached Files

    #2
    1 and 2) BarsRequired is the setting you set that prevents your strategy from running calculations till x amount of bars have passed. Setting it to zero does not necessarily mean all your indicators and such have feasible values yet and thus your strategy will not truly "start".

    In regards to being able to start your strategy after 30 minutes please take a look at the time filter reference sample here: http://www.ninjatrader-support.com/v...ead.php?t=3226

    3) Interesting. Will forward to development.

    4) That is not possible. In real-time you are building up the 3 minute bar as it unfolds. You can't possibly have the 3min bar already during the first 1min bar.

    5) In NT6.5 we have addressed this and allow you to place orders on any of your bar objects.

    6) Not sure what you are doing here. SetStopLoss() does not calculate anything. It just submits your stop loss order at whatever price you specified. To see your strategy's PnL you will want to use the Performance object. http://www.ninjatrader-support.com/H...CumProfit.html

    For unrealized PnL on your open position you can use GetProfitLoss().

    This reference sample may be of value for you: http://www.ninjatrader-support.com/v...ead.php?t=4084

    7) Setting the value to an arbitrarily high value will work. Otherwise you can just close out the position with another order and the stop loss order will cancel automatically after that. In NT6.5 you can do much more robust stop loss/profit target management through the use of the new OnOrderUpdate() method. Please see this reference sample: http://www.ninjatrader-support.com/v...ead.php?t=3917

    8) Session begin/end times should be set via the chart or when you start the strategy backtest. I don't see any real value in setting this from your code itself.

    Check out the time filter sample I linked you to above.

    9) The help file is linked to the Control Center. If you want to have them separately you can open the Help File via the shortcut in your Windows Start Menu.
    Josh P.NinjaTrader Customer Service

    Comment


      #3
      Josh, thanks for your post. However, there are still some points that are unclear.

      1 & 2: In the strategy I loaded (DateTimePrinter in the zip file) there are no indicators, so the strategy should start running immediately. If I comment out the line: Add(PeriodType.Day, 1);, the strategy begins running at 6/1/2007 01:00 instead of 6/3/2007 20:00.

      4. Assume we have have bars of 1 minute and 3 minutes. Under this implementation Bars[0][0] would reference the first 1 minute bar from time 0-59s, and the second 1 minute bar from time 60-119s. Similarly, Bars[1][0] would reference the first 3 minute bar from time 0-179s, and the second 3 minute bar from 180-359s. Using this scheme I don't think there would be a difference between real-time and historical data. I think the problem is that for historical data, the first 1 minute bar is created at time t=60s, and the first 3 minute bar is created at time t=180s, instead of both being created at t=0s.

      Regardless, say I am running a strategy on historical data and Bars[1][n] references a daily bar. Does Highs[1][0] give me todays high, or yesterday's high? My understanding is that it gives me yesterday's high, because today's daily bar has not yet closed so I can't access it. If that is the case, how do I get today's high?

      6. I am talking about the SetStopLoss(double currency) method, which does not specify a buy/sell price, but the amount you're willing to lose. In which case, NT has to calculate the buy/sell price.

      In the screenshot I posted, after the position is exited Performance.AllTrades.Performance.Currency.CumProf it, returns -40.112 instead of -50. The strategy I used here is the SetStopLoss strategy in the zip file.

      7. I am talking about for future trades. Assume I call EnterLong(), and then call SetStopLoss(double currency), and I then I exit that trade. Later on I call EnterLong() again, but do not call SetStopLoss(). NT still places a stop loss order for my second trade. The help page mentions resetting it, but I don't see how that is possible except by setting an arbitrarily high value.

      Thanks for all your help.

      Comment


        #4
        1 and 2) I believe since you are adding a 1day bar object and accessing the 1 day bar object it is required to first have that bar object before your strategy can return values. Basically it needs a day of 1min bars to go by before being able to have the values from the 1day resolution. Does that make sense?

        4) Let me try and explain it this way. On historical data, you will only know the 3 minute bar's values at the end of the 3rd 1min bar closes. This means after the three 1min bar closes then we can go and build the first 3min bar. In real-time running tick-by-tick the 1min bars are building in conjunction with the 3min bar. This is why all the ticks roll into the 1min bars as well as the 3min bar in unison. There is no need to wait for the 1st 3 1min bars to close before being able to build the 1st 3min bar.

        Your understanding on accessing OHLC will provide you with prior day's OHLC in that situation. To access current OHLC you want to use CurrentDayOHL(). http://www.ninjatrader-support.com/H...entDayOHL.html

        6) The issue is because of the ticksize of the instrument you are testing on. You are trying to tell it to exit you at an infeasible stop loss double value. On the chart NinjaTrader shows you it exited at a whole number price, but if you go into the trade logs you will see that the actual order actually is filled at a decimal price.

        To prevent this you should check the tick size of the instrument you are trading on. I will forward this to development to see if they can hardcode it in to not allow such trades at infeasible ticksizes.

        7) Correct. SetStopLoss() is generally used in the Initialize() method and it will submit a stop loss order for every position you open. To reset we simply mean to bring back the stop loss value in place with the method. This only pertains to you if you dynamically modify the stop loss level prior to entry.

        So if you had something going like this:
        originally you had this in Initialize method
        Code:
        SetStopLoss(50);
        then in your code logic you determine this particular entry is a bit more risky so you want to run a tighter stop.
        Code:
        SetStopLoss(10);
        EnterLong();
        Now before you enter again you want to reset the stop loss back to 50 prior to your next entry so it will maintain the default stop loss instead of taking on the special case 10 stop loss.
        Code:
        ExitLong();
        SetStopLoss(50);
        Josh P.NinjaTrader Customer Service

        Comment


          #5
          3) This is a current limitation when mixing intraday with daily bar series. In the meantime you will have to workaround it by reflecting this behavior in your code. As per my previous post I suggest you use CurrentDayOHL() for accessing those values instead of Highs[1][0] for now. http://www.ninjatrader-support.com/H...entDayOHL.html

          6) We will be changing the behavior for currency based stop/target orders. Please try again in the next NT6.5 beta.

          Thanks for bringing these up.
          Josh P.NinjaTrader Customer Service

          Comment


            #6
            3) I was wondering if #3 has been addressed? I recently started programming Ninja 7 and found the same issue still exists! The recommended solution of using CurrentDayOHL also has the same issue. When you are testing with Minute bars, mid-day, and then you reference CurrentDayOHL().CurrentHigh[0], it gives you the High for that day, even though the day isn't at the end of day yet. They do operate slightly differently in that the CurrentDayOHL goes back to the SessionTime (1800 previous day for Soybeans), where Highs[1][0] goes back to the beginning of the day session time (930 current day for Soybeans).

            Is there any plans to change/fix this so that it only reflects what has happened up to the minute in time the back testing has looked at, rather than giving a false answer by looking ahead?

            Thank you!
            Dennis

            Comment


              #7
              Hello,

              Checking on the status of this with development.

              Thanks for your patience.

              Comment


                #8
                Hello,

                This looks to be resolved.

                As I just did a test: Heres the output:

                The main BIP was a 1 minute chart the seconday was a daily.

                You can see that the 1 min series ran until 2:15 which is then end date for my session template I'm using. Then at this time the Low price for the 2/8 daily bar came in. Therefor everything look in sync in backtest.

                2/8/2011 2:09:00 PM : BIP0
                2/8/2011 2:10:00 PM : BIP0
                2/8/2011 2:11:00 PM : BIP0
                2/8/2011 2:12:00 PM : BIP0
                2/8/2011 2:13:00 PM : BIP0
                2/8/2011 2:14:00 PM : BIP0
                2/8/2011 2:15:00 PM : BIP0
                2/8/2011 2:15:00 PM : 1308.25 BIP 2

                Comment


                  #9
                  I think maybe I didn't clearly qualify what I was seeing. Look at this series output from Soybeans on 3/21. You will see the Highs[1][0] is set to 1367.75 at 7:15am. The same ACTUAL highest High[0] doesn't occur until 10:30am, the next bar. Lows[1][0] is set to 1351.50at 7:15am and the ACTUAL lowest Low[0] doesn't occur until 11:30am. Unless I am misunderstanding this, somehow it seems to know the Highs and Lows BEFORE the ACTUAL High and Low happens.
                  Please help me understand!
                  Thank you!
                  Dennis

                  20110321 0050000Highs[1][0]: 1385.75High[0]: 1370.25Lows[1][0]: 1339.25Low[0]: 1367.00
                  20110321 0060000Highs[1][0]: 1385.75High[0]: 1369.25Lows[1][0]: 1339.25Low[0]: 1364.50
                  20110321 0070000Highs[1][0]: 1385.75High[0]: 1370.75Lows[1][0]: 1339.25Low[0]: 1363.75
                  20110321 0071500Highs[1][0]: 1367.75High[0]: 1369.00Lows[1][0]: 1351.50Low[0]: 1366.75
                  20110321 0103000Highs[1][0]: 1367.75High[0]: 1367.75Lows[1][0]: 1351.50Low[0]: 1352.25
                  20110321 0113000Highs[1][0]: 1367.75High[0]: 1358.00Lows[1][0]: 1351.50Low[0]: 1351.50
                  20110321 0123000Highs[1][0]: 1367.75High[0]: 1362.00Lows[1][0]: 1351.50Low[0]: 1352.00
                  20110321 0131500Highs[1][0]: 1367.75High[0]: 1365.00Lows[1][0]: 1351.50Low[0]: 1354.00
                  20110321 0190000Highs[1][0]: 1367.75High[0]: 1364.75Lows[1][0]: 1351.50Low[0]: 1358.00
                  20110321 0200000Highs[1][0]: 1367.75High[0]: 1359.50Lows[1][0]: 1351.50Low[0]: 1354.50
                  20110321 0210000Highs[1][0]: 1367.75High[0]: 1358.75Lows[1][0]: 1351.50Low[0]: 1354.50
                  20110321 0220000Highs[1][0]: 1367.75High[0]: 1356.00Lows[1][0]: 1351.50Low[0]: 1352.50
                  20110321 0230000Highs[1][0]: 1367.75High[0]: 1356.00Lows[1][0]: 1351.50Low[0]: 1355.00
                  20110322 0000000Highs[1][0]: 1367.75High[0]: 1355.75Lows[1][0]: 1351.50Low[0]: 1353.75
                  20110322 0010000Highs[1][0]: 1367.75High[0]: 1354.00Lows[1][0]: 1351.50Low[0]: 1351.75
                  20110322 0020000Highs[1][0]: 1367.75High[0]: 1353.75Lows[1][0]: 1351.50Low[0]: 1352.00
                  20110322 0030000Highs[1][0]: 1367.75High[0]: 1353.75Lows[1][0]: 1351.50Low[0]: 1352.00
                  20110322 0040000Highs[1][0]: 1367.75High[0]: 1352.50Lows[1][0]: 1351.50Low[0]: 1350.50
                  20110322 0050000Highs[1][0]: 1367.75High[0]: 1352.50Lows[1][0]: 1351.50Low[0]: 1348.00
                  20110322 0060000Highs[1][0]: 1367.75High[0]: 1350.00Lows[1][0]: 1351.50Low[0]: 1346.25
                  20110322 0070000Highs[1][0]: 1367.75High[0]: 1347.50Lows[1][0]: 1351.50Low[0]: 1345.00

                  Comment


                    #10
                    What data series is BIP 0 and BIP 1? What time frames are both and what session templates are in use?

                    Also, what line are you using to Print this out. Can you please post the sample code your using to output this.

                    I look forward to assisting you further.

                    Comment

                    Latest Posts

                    Collapse

                    Topics Statistics Last Post
                    Started by Barry Milan, Yesterday, 10:35 PM
                    5 responses
                    16 views
                    0 likes
                    Last Post NinjaTrader_Manfred  
                    Started by DanielSanMartin, Yesterday, 02:37 PM
                    2 responses
                    13 views
                    0 likes
                    Last Post DanielSanMartin  
                    Started by DJ888, 04-16-2024, 06:09 PM
                    4 responses
                    13 views
                    0 likes
                    Last Post DJ888
                    by DJ888
                     
                    Started by terofs, Today, 04:18 PM
                    0 responses
                    12 views
                    0 likes
                    Last Post terofs
                    by terofs
                     
                    Started by nandhumca, Today, 03:41 PM
                    0 responses
                    8 views
                    0 likes
                    Last Post nandhumca  
                    Working...
                    X