Announcement

Collapse

Looking for a User App or Add-On built by the NinjaTrader community?

Visit NinjaTrader EcoSystem and our free User App Share!

Have a question for the NinjaScript developer community? Open a new thread in our NinjaScript File Sharing Discussion Forum!
See more
See less

Partner 728x90

Collapse

Explanation of different results please

Collapse
X
 
  • Filter
  • Time
  • Show
Clear All
new posts

    Explanation of different results please

    I opened up an old indicator I had previously programmed to make some changes. This was one of the first I had done in NinjaScript, and at the time I had a habit of doing all my calculations, storing the result into a double, and then using Set to store the double into a DataSeries.

    Like this for example....

    Code:
    phaseTemp = atanRadians*(180/Math.PI);
                    Phase.Set(phaseTemp);
    Later, I came to believe that this step was redundant, and have since been skipping the store in double first step, like this...

    Code:
    Value.Set(((Math.Min(CurrentBar + 1, Period) - 1 ) * Value[1] + trueRange) / Math.Min(CurrentBar + 1, Period));
    The above is from the default ATR code...

    So today, I had was working on my old indicator where I did my calculations outside the Set method, stored the result in a double, and then stored the double into the DataSeries with the Set method.... here's the code section...

    Code:
    if (Math.Abs(InPhase[0] + InPhase[1]) > 0)
                {
                    
                    tangent = Math.Abs((Quadrature[0]+Quadrature[1])/(InPhase[0]+InPhase[1]));
                    atanRadians = Math.Atan(tangent);
                    phaseTemp = atanRadians*(180/Math.PI);
                    Phase.Set(phaseTemp);
                }
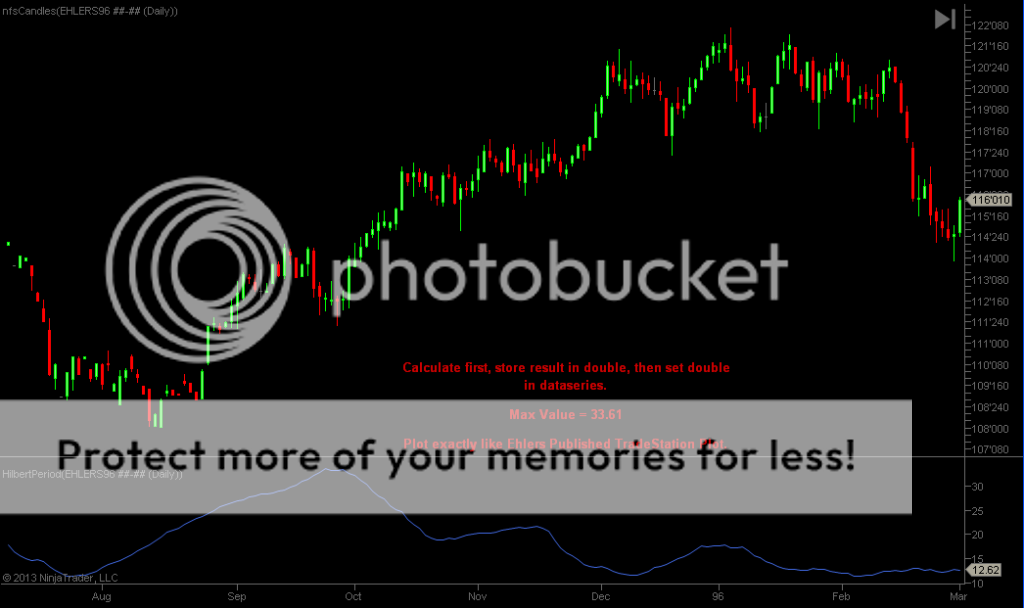
    This version of the code plotted like this....


    Which I am really happy with, because it exactly matches the chart Published in Ehlers' article below:


    But thinking that it was a redundant step to first store the calculation result in a double, I refactored the code to this....

    if (Math.Abs(InPhase[0] + InPhase[1]) > 0)
    {

    tangent = Math.Abs((Quadrature[0]+Quadrature[1])/(InPhase[0]+InPhase[1]));
    atanRadians = Math.Atan(tangent);

    Phase.Set(atanRadians*(180/Math.PI));
    }

    To my shock this code plots very differently... the result is way off...
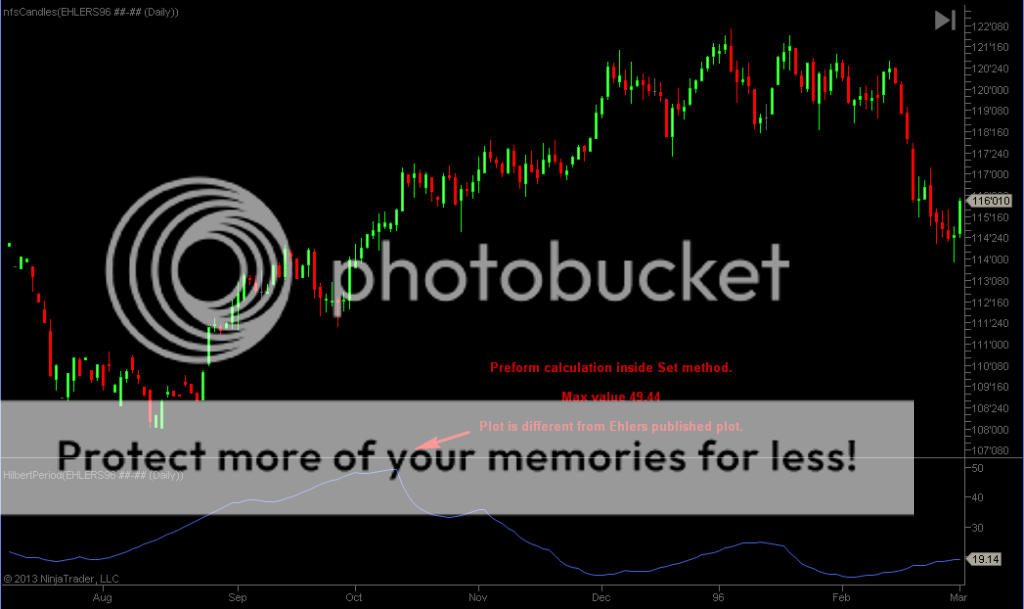


    The max reading is much higher than before... especially in a percentage basis, as this indicator can only range between 6 and 50.... At Max reading on this chart, its a difference of 15.83 points...

    Moving the atanRadians*(180/Math.PI) line inside the Set parens is the only change needed to make such a drastic change.

    So now I am wondering why?

    I know an easy answer would be, so don't do it like that then.... but I want to know why its doing it, because we often see calculations done inside the Set method line....
    Last edited by Crassius; 03-21-2013, 09:25 AM.

    #2
    Hello Crassius,

    I have ran a few tests and I am not getting different values so far. Is it possible that the data has changed, can you remove the indicator create two different charts and add the indicator on each one with the different methods of plotting?
    JCNinjaTrader Customer Service

    Comment


      #3
      Originally posted by NinjaTrader_JC View Post
      Hello Crassius,

      I have ran a few tests and I am not getting different values so far. Is it possible that the data has changed, can you remove the indicator create two different charts and add the indicator on each one with the different methods of plotting?

      Here it is on MSFT loaded 1/3/2011 to 3/15/2013 on two different charts....

      I have attached my indicator... Look around line 100... Its easy to comment out a line or two and get both results...

      You should have the MSFT data... I got it from Kinetick EOD... I suggest you load the entire date range... to match what I have done on my end...
      Attached Files
      Last edited by Crassius; 03-21-2013, 08:05 PM.

      Comment


        #4
        Originally posted by Crassius View Post
        Here it is on MSFT loaded 1/3/2011 to 3/15/2013 on two different charts....

        I have attached my indicator... Look around line 100... Its easy to comment out a line or two and get both results...

        You should have the MSFT data... I got it from Kinetick EOD... I suggest you load the entire date range... to match what I have done on my end...
        While your results do look like a substantial difference, let us first check that we are not seeing a rounding error on small values.

        How about you change to this, so that we can see the full values in the Output Window:
        Code:
        if (Math.Abs(InPhase[0] + InPhase[1]) > 0)
        {
        tangent = Math.Abs((Quadrature[0]+Quadrature[1])/(InPhase[0]+InPhase[1]));
        atanRadians = Math.Atan(tangent);
        phaseTemp = atanRadians*(180/Math.PI);
        [COLOR=blue]Print(" phaseTemp: " + phaseTemp);
        [/COLOR]Phase.Set(atanRadians*(180/Math.PI));
        [COLOR=blue]Print("DataSeries value: " + Phase[0]);
        [/COLOR]}

        Comment


          #5
          Originally posted by koganam View Post
          While your results do look like a substantial difference, let us first check that we are not seeing a rounding error on small values.

          How about you change to this, so that we can see the full values in the Output Window:

          I am such an idiot !

          Playing around with that for few minutes, and likely because I stepped away from debugging for a few hours, led me to the realization that one way I could be getting the results I was experiencing would be if I used phaseTemp later in the code...

          and I did... of course... a few lines later I have....

          Code:
          //Resolve ArcTangent Ambiquity
                      if (InPhase[0] < 0 && Quadrature[0] > 0)
                      {
                          Phase.Set(180 - phaseTemp);
                      }
          Thanks for the help... sorry....

          Comment

          Latest Posts

          Collapse

          Topics Statistics Last Post
          Started by Shansen, 08-30-2019, 10:18 PM
          24 responses
          938 views
          0 likes
          Last Post spwizard  
          Started by Max238, Today, 01:28 AM
          0 responses
          3 views
          0 likes
          Last Post Max238
          by Max238
           
          Started by rocketman7, Today, 01:00 AM
          0 responses
          2 views
          0 likes
          Last Post rocketman7  
          Started by wzgy0920, 04-20-2024, 06:09 PM
          2 responses
          27 views
          0 likes
          Last Post wzgy0920  
          Started by wzgy0920, 02-22-2024, 01:11 AM
          5 responses
          32 views
          0 likes
          Last Post wzgy0920  
          Working...
          X