Announcement

Collapse

Looking for a User App or Add-On built by the NinjaTrader community?

Visit NinjaTrader EcoSystem and our free User App Share!

Have a question for the NinjaScript developer community? Open a new thread in our NinjaScript File Sharing Discussion Forum!
See more
See less

Partner 728x90

Collapse

Oscillator of Moving Ave (OsMA) Needed

Collapse
X
 
  • Filter
  • Time
  • Show
Clear All
new posts

    Oscillator of Moving Ave (OsMA) Needed

    My 1st post ever so hope this is correct approach and location
    Wondering if the Oscillator of Moving Average Indicator has been developed for NinjaTrader. I currently use this in MetaTrader 4 and would like to continue to use it in NinjaTrader. Can not see it as a deafult and wondered if anyone had developed the script for it.

    Borrowed the following definition in case clarification of the indicator I am referring to, is needed. Thanks in advance, any help appreciated.
    -----------------------------------------------------
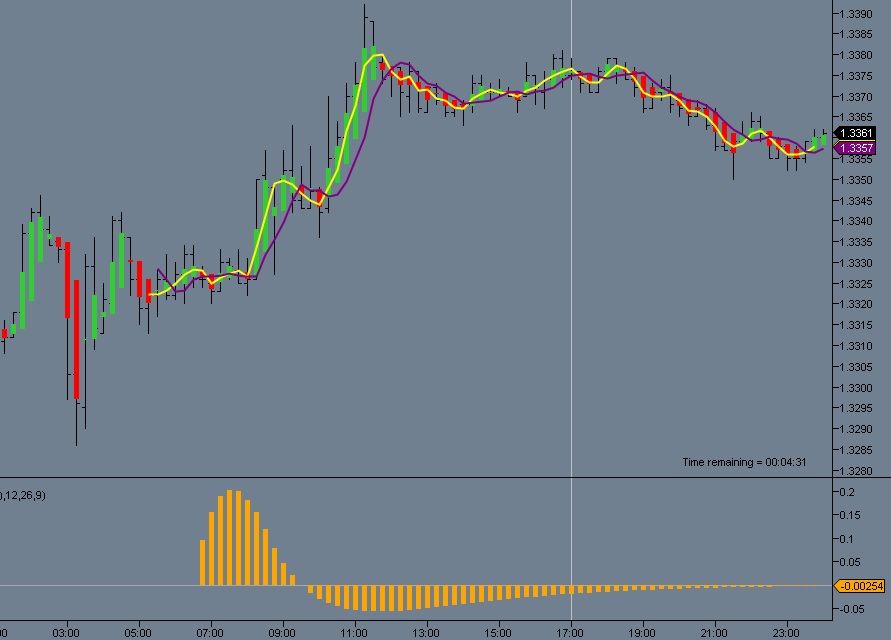
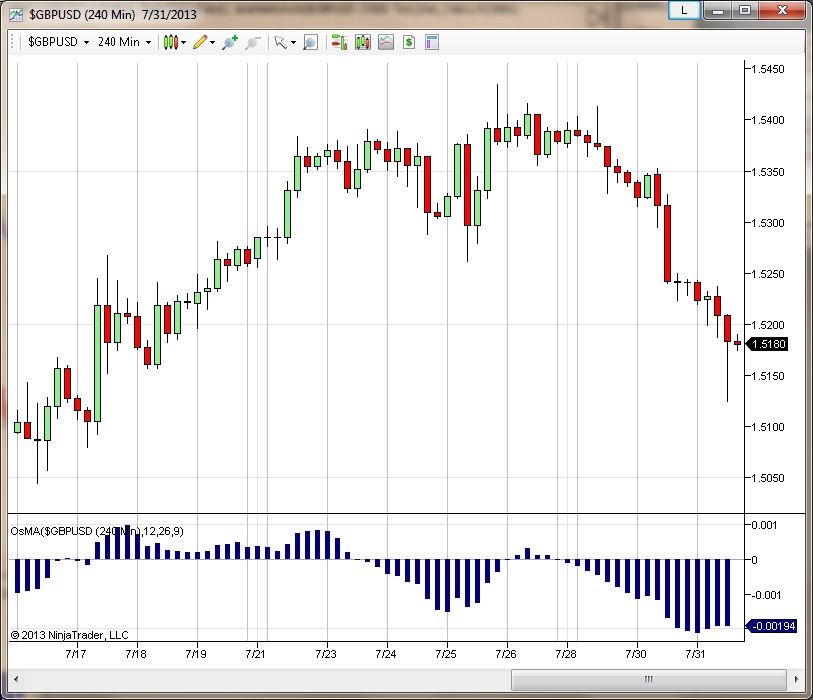
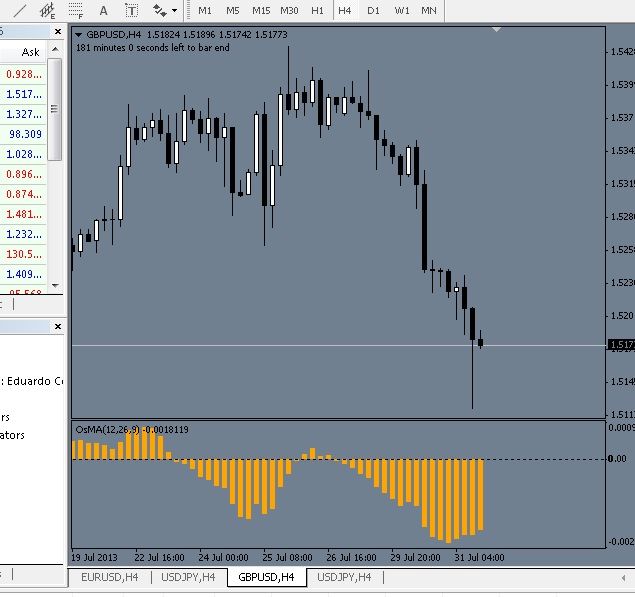
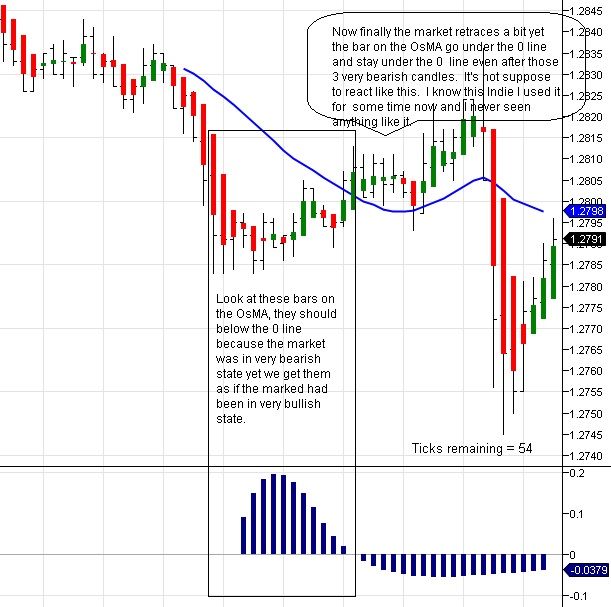
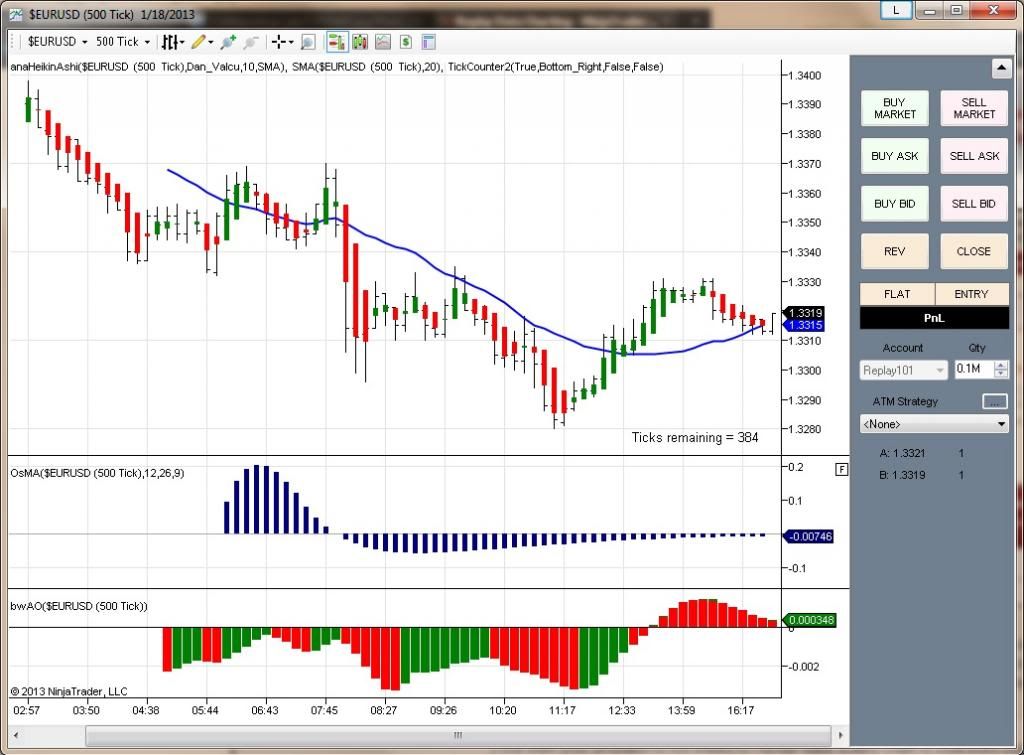
    Moving Average of Oscillator is the difference between the oscillator and oscillator smoothing. The signal line of MACD is used for smoothing and the basic line of MACD is used as an oscillator.If OsMA stops decreasing and starts increasing it's the signal for buying. If OsMA ceases increasing and starts decreasing its' the signal for sale. The discrepancy of the price and OsMA is a trustworthy signal.
    ------------------------------------------------------

    #2
    Hello,

    Thank you for your first forum post.

    This indicator I could not locate on my search of our free indicators on our forums. This may have been developed from a third party partner.

    This indicator could also be added to NinjaTrader with NinjaScript.

    Third party Partners:


    You can contact one of our NinjaScript consultants to assist you with coding this or you can use our NinjaScript guide and forums to code this indicator yourself if you are a programmer.

    NinjaScript Consultants:

    NinjaScript Help Guide:

    NinjaTrader Support Forum:

    Strategy Wizard:


    Let me know if I can be of further assistance.

    Comment


      #3
      Here it is...

      See if this fits the bill.

      Dan
      Attached Files
      eDanny
      NinjaTrader Ecosystem Vendor - Integrity Traders

      Comment


        #4
        Originally posted by eDanny View Post
        See if this fits the bill.

        Dan
        When using it with replay data it works fine with time charts but it acts really weird with tick charts, completely useless if you use tick charts using replay data but it works fine when using real time data on both time and ticks. It would be nice if someone could fix this bug.

        Comment


          #5
          This is what I get sometimes using this indicator, I don't think it's compatible with NT7, Could someone make compatible with the latest NT?

          Comment


            #6
            Originally posted by idude View Post
            This is what I get sometimes using this indicator, I don't think it's compatible with NT7, Could someone make compatible with the latest NT?

            What is the problem? Looks fine to me.

            Comment


              #7
              Please compare these two charts one in NT and the other on MT4, same time interval.


              as you can see there's something strange about NT's OsMA, not only this but it all can wipe out every candle on my chart where you end up with a blank chart. Something is not right about it, unfortunately this is the only OsMA indicator that I can find for NT.

              Regards,
              Ed

              Comment


                #8
                Originally posted by idude View Post
                Please compare these two charts one in NT and the other on MT4, same time interval.


                as you can see there's something strange about NT's OsMA, not only this but it all can wipe out every candle on my chart where you end up with a blank chart. Something is not right about it, unfortunately this is the only OsMA indicator that I can find for NT.

                Regards,
                Ed
                Your MT4 code is different from the NT code. The MT4 code is plotting the difference between the 2 squiggly lines: the NT code is plotting the difference between 2 independent moving averages, and its smoother.

                Comment


                  #9
                  I don't think so because like I said before I can get it to work sometimes and when I do, it will look just like my mt4. I will post to more shots when I get it to work.

                  Comment


                    #10
                    Ok I have it working on the GU pair

                    Here's NT's


                    Here's MT4


                    They are pretty much identical don't you agree? This is my point that there's has something causing it to act the way it does.

                    Comment


                      #11
                      Originally posted by idude View Post
                      Ok I have it working on the GU pair

                      Here's NT's


                      Here's MT4


                      They are pretty much identical don't you agree? This is my point that there's has something causing it to act the way it does.
                      They are different code does not mean that they can never Plot the same. If your MT4 code matches the parameters of the NT code, they will plot the same. What are the parameters that you are using in each of the different platforms? I will venture to say that you are probably using the MACD as your oscillator in your MT4 code. Am I right?

                      Comment


                        #12
                        The only thing it says on my mt4 is MACD SMA 9.

                        I've had these on both platforms on a 5 minute chart for two days and the movements on both OsMA from the 0 line were exactly the same on both.

                        Comment


                          #13
                          Originally posted by idude View Post
                          The only thing it says on my mt4 is MACD SMA 9.

                          I've had these on both platforms on a 5 minute chart for two days and the movements on both OsMA from the 0 line were exactly the same on both.
                          They would be!! I have looked at the NT code source, and all it is is a MACD, using an SMA instead of an EMA for the signal line. That is pretty much what your MT4 says.

                          However, even given that we have confirmed that you are using parameters that should give you equal plots, we also have to remember that the MACD uses EMA's. EMA is an infinite impulse response filter, so until quite far in, there will be differences that depend on how the series are initialized and when.

                          Given enough distance, they should begin to be pretty much the same, regardless of the initial conditions. I do not know how MT4 initializes the EMA, so the only thing that I can say for certain, is that, in all likelihood, even with the same parameters, the NT plot will not match the MT4 plot until you have quite a few bars on the charts, possibly as many as 100 or more. I could calculate the proper convergence period, but it is probably unnecessary, and I am too lazy to do so. I am sure that there is an internet reference somewhere that discusses the convergence of EMA's..

                          Comment


                            #14
                            Originally posted by koganam View Post
                            They would be!! I have looked at the NT code source, and all it is is a MACD, using an SMA instead of an EMA for the signal line. That is pretty much what your MT4 says.

                            However, even given that we have confirmed that you are using parameters that should give you equal plots, we also have to remember that the MACD uses EMA's. EMA is an infinite impulse response filter, so until quite far in, there will be differences that depend on how the series are initialized and when.

                            Given enough distance, they should begin to be pretty much the same, regardless of the initial conditions. I do not know how MT4 initializes the EMA, so the only thing that I can say for certain, is that, in all likelihood, even with the same parameters, the NT plot will not match the MT4 plot until you have quite a few bars on the charts, possibly as many as 100 or more. I could calculate the proper convergence period, but it is probably unnecessary, and I am too lazy to do so. I am sure that there is an internet reference somewhere that discusses the convergence of EMA's..

                            Do you have this indy installed? If you do please try this: Plot it on a chart now just move the chart to the right to see past data. You will see that the bars will get overly smooth as you go into the past, mt4 or tradestation will not react like this as you move to see past data. This is a fast reacting indicator with the default settings and it's not suppose to get this smooth, you will notice as you go into past data that even though you will get, for example, a very bullish uptrend after a downtrend and yet this OsMA fails to go above the 0 line. It's not suppose to act like this.

                            Now connect to your Replay Data server and plot this OsMA you will be lucky to get bars at all, half of time when I run this indicator I can't even get a bar to show yet every other BW indicator works just fine with Replay Data. Please take a look at this chart in replay data and take a look at my notes. Note that these bars, their size their smoothness are basically the same as another plot that I posted below showing another completely different chart then this one. I could stay and post charts from other pairs and you will this that these bars end up making the same wave that you see on this one.

                            Last edited by idude; 07-31-2013, 07:15 PM.

                            Comment


                              #15
                              Now let's look at chart again on 1/18/13 but this time with AO which is a smoother indy at default settings meanwhile compare OsMA chart with my last chart on april 2013 you should notice that OsMA is painting exactly the same bars that it painted before on other charts that I posted.

                              Comment

                              Latest Posts

                              Collapse

                              Topics Statistics Last Post
                              Started by frankthearm, Yesterday, 09:08 AM
                              14 responses
                              47 views
                              0 likes
                              Last Post NinjaTrader_Clayton  
                              Started by gentlebenthebear, Today, 01:30 AM
                              2 responses
                              13 views
                              0 likes
                              Last Post gentlebenthebear  
                              Started by Kaledus, Today, 01:29 PM
                              2 responses
                              8 views
                              0 likes
                              Last Post Kaledus
                              by Kaledus
                               
                              Started by PaulMohn, Today, 12:36 PM
                              2 responses
                              16 views
                              0 likes
                              Last Post PaulMohn  
                              Started by Conceptzx, 10-11-2022, 06:38 AM
                              2 responses
                              56 views
                              0 likes
                              Last Post PhillT
                              by PhillT
                               
                              Working...
                              X