Announcement

Collapse

Looking for a User App or Add-On built by the NinjaTrader community?

Visit NinjaTrader EcoSystem and our free User App Share!

Have a question for the NinjaScript developer community? Open a new thread in our NinjaScript File Sharing Discussion Forum!
See more
See less

Partner 728x90

Collapse

Oversold/bought RSI plot on chart

Collapse
X
 
  • Filter
  • Time
  • Show
Clear All
new posts

    Oversold/bought RSI plot on chart

    I think it's better posting a new thread,
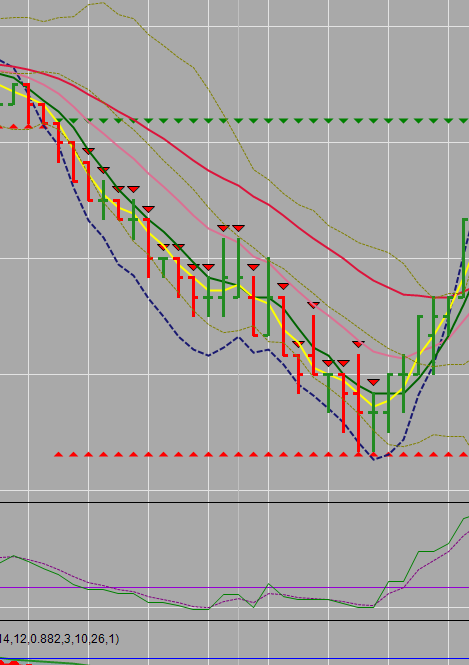
    i want these arrows on certain bars to avoid a RSI indicator-panel.
    That way (day-trading) it marks eventually entry points.
    But i can't change the triangle colors.
    Maybe an other plot would be used, but wich one ?

    Attached a screenshot.
    Attached Thumbnails
    Attached Files
    Last edited by mate41; 09-02-2011, 07:01 AM.

    #2
    mate41,

    It's not clear what is wrong with the current display of the indicator. Can you specify what is not working? You mentioned you can't change the triangle colors - how would you like them to change? Based off a condition? Would you like to change this programmatically, or would you like to change them manually through the properites?

    Do you feel the triangles are not plotted at the correct overbought/oversold values?
    MatthewNinjaTrader Product Management

    Comment


      #3
      Hi Matthew,
      the indicator works correctly. I want to change the colors and plot-style manually through the properties.
      Can't do it with 'DrawTriangleUp' and '....Dow'. I don't know why.
      Last edited by mate41; 09-02-2011, 07:21 AM.

      Comment


        #4
        mate41,

        Thanks for the clarification -

        You can create a user defined color input variable for the colors you are using in the draw method of the DrawTriangles.

        Please review our Tips section on User Definable Color Inputs and let me know if you have any questions:

        MatthewNinjaTrader Product Management

        Comment


          #5
          Thanks for the help Matthew,
          i'll see the rest later. The indicator do what it have to do and runs perfectly. The rest is embellish the indicator with colors and plot-style.

          Comment

          Latest Posts

          Collapse

          Topics Statistics Last Post
          Started by WHICKED, Today, 12:56 PM
          2 responses
          15 views
          0 likes
          Last Post WHICKED
          by WHICKED
           
          Started by Felix Reichert, Today, 02:12 PM
          0 responses
          1 view
          0 likes
          Last Post Felix Reichert  
          Started by Tim-c, Today, 02:10 PM
          0 responses
          1 view
          0 likes
          Last Post Tim-c
          by Tim-c
           
          Started by cre8able, Today, 01:16 PM
          2 responses
          9 views
          0 likes
          Last Post cre8able  
          Started by chbruno, 04-24-2024, 04:10 PM
          3 responses
          49 views
          0 likes
          Last Post NinjaTrader_Gaby  
          Working...
          X