
This thread was moved from
I found a flaw in the MIDAS Explorer "MIDAS Touch" indicator when launching from a range chart.
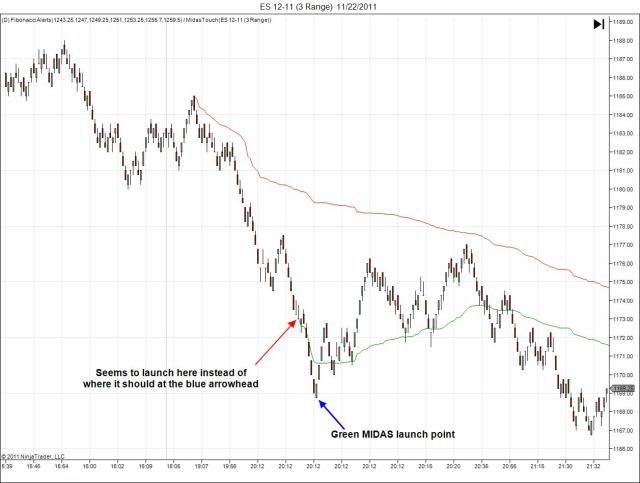
Using a 3-range chart on ES from today, I launched 2 MIDAS curves. A red curve from the peak at 18:59:33, and a green curve from the minimum corresponding to the 8th bar of the timeframe 20:12:12.
Note that MIDAS launched the curve from the 1st bar of the 20:12:12 timeframe, and not the 8th, yielding an incorrect curve result.
The fix via NT would be to further subdivide bars to actually have a count, when there are more bars generated than 1 per second. So the first bar of 20:12:12 would be called 20:12:12:1 and the 8th bar of 20:12:12 would be called 20:12:12:8.
Not even trying to fix it to the low will work as it just sees the first bar of any one second interval.
Any way to correct this limitation?
I found a flaw in the MIDAS Explorer "MIDAS Touch" indicator when launching from a range chart.
Using a 3-range chart on ES from today, I launched 2 MIDAS curves. A red curve from the peak at 18:59:33, and a green curve from the minimum corresponding to the 8th bar of the timeframe 20:12:12.
Note that MIDAS launched the curve from the 1st bar of the 20:12:12 timeframe, and not the 8th, yielding an incorrect curve result.
The fix via NT would be to further subdivide bars to actually have a count, when there are more bars generated than 1 per second. So the first bar of 20:12:12 would be called 20:12:12:1 and the 8th bar of 20:12:12 would be called 20:12:12:8.
Not even trying to fix it to the low will work as it just sees the first bar of any one second interval.
Any way to correct this limitation?

Comment