Announcement

Collapse

Looking for a User App or Add-On built by the NinjaTrader community?

Visit NinjaTrader EcoSystem and our free User App Share!

Have a question for the NinjaScript developer community? Open a new thread in our NinjaScript File Sharing Discussion Forum!
See more
See less

Partner 728x90

Collapse

Is there a 'Session Mid-Point' indicator for NT7 ?

Collapse
X
 
  • Filter
  • Time
  • Show
Clear All
new posts

    Is there a 'Session Mid-Point' indicator for NT7 ?

    Hi Gang!

    Is there somewhere a NT7 indicator that can plot the Day Session Mid-Point ?
    I am a mean-reversion guy who like to place those rubber band trades when price runs too far away from the mean, and would like to have an indicator that plots the day session mid-point, that i could use as price target for my trades.

    This indicator would just have to track the 24hour High-of-Day (HoD) and Low-of-Day (LoD) prices from my chart, and dynamically perform the following calculation: (HOD-LOD)/2 and plot the result in a line form, similar to a Moving Average indicator line.

    I have looked though the NT7 custom indicators page on this forum but could not find anything related to the session mid point plotting.

    Would be grateful if anyone could point me to such indicator.

    Many Thanks in advance!
    Cheers

    #2
    Hello,

    Thank you for your post and welcome to our forums!

    Unfortunately I am not aware of an existing indicator which would accomplish this for you, however it is completely possible to do so.

    If no one from the community can help you locate this type of indicator, you can always discuss your requirements with a certified NinjaScript consultant:

    MatthewNinjaTrader Product Management

    Comment


      #3
      This would work. Probably not to hard to code for someone with some programming.


      indicatorwarehouse.com/trading-indicators/ninjatrader-indicators/chart-enhancement-indicators/?product=time-zones-color-chart-background


      Originally posted by Robby608 View Post
      Hi Gang!

      Is there somewhere a NT7 indicator that can plot the Day Session Mid-Point ?
      I am a mean-reversion guy who like to place those rubber band trades when price runs too far away from the mean, and would like to have an indicator that plots the day session mid-point, that i could use as price target for my trades.

      This indicator would just have to track the 24hour High-of-Day (HoD) and Low-of-Day (LoD) prices from my chart, and dynamically perform the following calculation: (HOD-LOD)/2 and plot the result in a line form, similar to a Moving Average indicator line.

      I have looked though the NT7 custom indicators page on this forum but could not find anything related to the session mid point plotting.

      Would be grateful if anyone could point me to such indicator.

      Many Thanks in advance!
      Cheers

      Comment


        #4
        Hi Matthew!
        Many Thanks for your prompt reply and guidance! much appreciated.
        I shall wait for another 48Hrs, and will raise my request with a NT consultant as you suggested if no other solution comes my way.

        Again, Many Thanks and Have a Great Evening !

        Comment


          #5
          Hi Sledge,
          Thank You for your reply.

          The link you have provided is pointing to an external vendor indicator that colors Time Ranges on a NT chart, hence totally unrelated to my enquiry. Once again, I am looking for an indicator that plots the Price Mid-Point for a Day Session: Price Mid-Point = (Hod-Lod)/2

          Please find attached a chart example where the Price Mid-Point is plotted in a grey line (this is using MetaStock):

          Comment


            #6
            Please find a MetaStock chart example that is plotting the Price Mid-Point using a grey line.
            This is what I would like to accomplish with NT7.
            Attached Files

            Comment


              #7
              Originally posted by Robby608 View Post
              Hi Sledge,
              Thank You for your reply.

              The link you have provided is pointing to an external vendor indicator that colors Time Ranges on a NT chart, hence totally unrelated to my enquiry. Once again, I am looking for an indicator that plots the Price Mid-Point for a Day Session: Price Mid-Point = (Hod-Lod)/2

              Please find attached a chart example where the Price Mid-Point is plotted in a grey line (this is using MetaStock):
              Sorry, i should read the whole post first (was on the bus and hurrying).

              This opening range indicator code be a good starting point to modify. Also merging with colorrange2 in the free section, for drawing areas in color.

              Comment


                #8
                Originally posted by Robby608 View Post
                This indicator would just have to track the 24hour High-of-Day (HoD) and Low-of-Day (LoD) prices from my chart, and dynamically perform the following calculation: (HOD-LOD)/2 and plot the result in a line form, similar to a Moving Average indicator line.
                Actually I believe you will want (HOD + LOD) / 2. I made a simple indicator for this let me know if it does what you're looking for.
                Attached Files

                Comment


                  #9
                  Hi Overflowing!

                  This is exactly what I wanted! Thank You So Much!
                  I have tested your Indicator and confirm that it works great.. and YES, the actual plot formula should read: (Lod+Hod)/2 , you got that right!

                  I will send another request to the NT Consultants to have this indicator added as standard code in one of future NT7 releases, hopefully it will.

                  Price always revert to the MidPoint ! I will post a Chart reflecting the price action on the S&P500 E-mini today and we are almost back to the MidPoint after the late morning sell-off (the trade is still developing as I type this).

                  Again, many thanks for your prompt support, very much appreciated...
                  Have a great day!
                  Rob

                  Originally posted by overflowing View Post
                  Actually I believe you will want (HOD + LOD) / 2. I made a simple indicator for this let me know if it does what you're looking for.

                  Comment


                    #10
                    You're welcome! How far do you let price get away from the midpoint before entering on the ES?

                    Comment


                      #11
                      Session Price Mid-Point indicator

                      Hi Overflow,

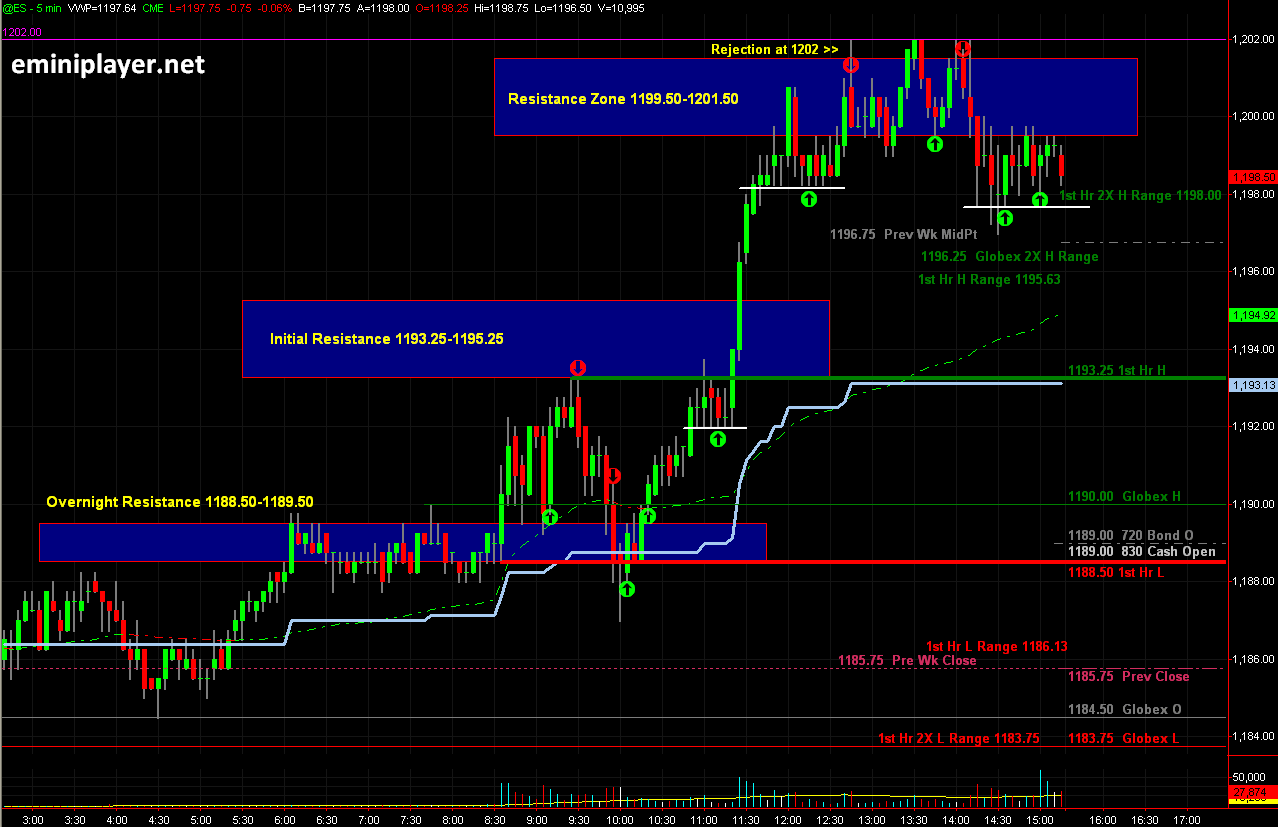
                      IMHO, there is no fix amount of price to gun for. What I do is look for price to stall at a Key Support or Resistance level that I mark on my charts ahead of time (see the colored zones in the attached chart samples) and look for the Mid-Point as potential price target..

                      The 24Hr Mid-Point reversal trade is my favorite (although the RTH Mid-Point Reversal works pretty well too), pretty much all the time after a big trend day, or when there was a large move in the overnight (Globex) market. Traders also refer to this as a 'Rubber-Band Trade' as imbalance leads back to balance.

                      Otherwise, I also do a lot of real-time analysis of Price Action with corresponding Fib work, and Volume Profile analysis during the first hour of trade (9:30-10:30EST).

                      Typically, I look either for a test of a Low Volume Node away from the Mid-Point (that will trigger a bounce back to the Mid-Point), or an Impulse Move on high volume on the 1Mn Chart during the first hour of trade, then do the Fib work to locate an entry at the 38.2% Retracement, if that does not hold, I scratch immediately and re-enter at the 50% or 61.8% levels. usually, the strong impulse moves always bounce on one of these levels, and even better when there is confluence with other stuff (e.g. key structure levels, 50(SMA), 200 (SMA) at higher timeframes, Floor Pivots, that will activate more traders along with me), but I remain flexible at all times and quick to scratch if I am on the wrong side of the market.

                      FYI, I have a 'Market Internals' screen with four 1mn Charts of NYSE Tick, NYSE Breadth, VIX, and NYSE Volume that I use as Market Gauges for evidence of activity of the dominant force re-entering the market with me at my entry point. It's like surfing the waves of buying(or selling) energy entering the market. Better make sure there are pushing in the right direction, if not... abandon ship and just get-the-hell-out !
                      Lastly , I always use Stops (typically 6-8 ticks)

                      My main philosophy is: Keep the losses small and let the profits run!
                      This business is all about Risk Management my friend.
                      Always be Risk-Averse, never be Risk-Seeking !
                      Accumulating lots of small profits is the name of the game (I no longer dream of making killer moves, fear and greed are always the downfall of retail traders).

                      See attached Globex and RTH charts for 02 Aug2012.
                      The Support and Resistance levels are from EminiPlayer.NET and they are SOLID ! (day-in and day-out)

                      Feel free to put this price indicator on your charts, and be prepared to be amazed !
                      Attached Files
                      Last edited by Robby608; 08-02-2012, 03:38 PM.

                      Comment


                        #12
                        Are you using volume profile on ninjatrader? If so, which indicator are you using? And if not, what do you use for your volume profiles? Do you follow ft71

                        Comment


                          #13
                          where is this lvn and hvn or poc indicator for NT located please, thank u
                          keith

                          Comment


                            #14
                            Hello Godblesskr, and welcome to the forums!

                            The following searches should help you find some pages in the forums that have the information you are looking for regarding custom indicators.

                            poc


                            lvn


                            hvn


                            It will help other users of the forum if you ask questions like this in their own thread. Thank you for using NinjaTrader.
                            Jessica P.NinjaTrader Customer Service

                            Comment

                            Latest Posts

                            Collapse

                            Topics Statistics Last Post
                            Started by Waxavi, Today, 02:10 AM
                            0 responses
                            3 views
                            0 likes
                            Last Post Waxavi
                            by Waxavi
                             
                            Started by TradeForge, Today, 02:09 AM
                            0 responses
                            8 views
                            0 likes
                            Last Post TradeForge  
                            Started by Waxavi, Today, 02:00 AM
                            0 responses
                            2 views
                            0 likes
                            Last Post Waxavi
                            by Waxavi
                             
                            Started by elirion, Today, 01:36 AM
                            0 responses
                            4 views
                            0 likes
                            Last Post elirion
                            by elirion
                             
                            Started by gentlebenthebear, Today, 01:30 AM
                            0 responses
                            4 views
                            0 likes
                            Last Post gentlebenthebear  
                            Working...
                            X