
Dear Support
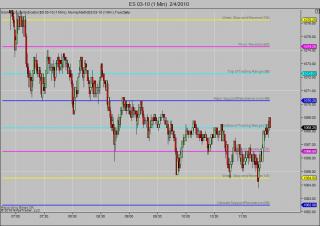
I would like lines horizontal lines displayed on my chart for FX pairs at the figure/100, the 20, 50, and 80 levels.
I'm using the native NT7 grid to draw the 50 and figure/100 levels just fine, but since I want to draw lines at irregular intervals this won't work for me in the end.
How would I approach coding an indicator to plot the 20 and 80 levels for me above/below the current price by several hundred (user defined range) pips?
Thanks!

Comment