
Hello,
On Bloomberg Terminal, there is a standard indicator called "Range Average SD Bands"...SD stands for Standard Deviation Bands.
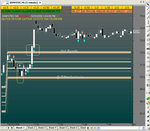
Basically the idea is that for any price chart, there will be a horizontal line for "Average" and 2 horizontal lines above the average for Average + 1 Standard Deviation and Average + 2 Standard Deviation. Likewise there will be 2 horizontal lines below for the average for Average - 1 Standard Deviation and Average - 2 Standard Deviation.
Also, all these lines are color coded differently. In addition, these lines are constantly calculated and displayed on the screen. User also has the following options:
1) To determine how many bars to look back to calculate this Standard Deviations
2) By default, if the user were to scroll back on the chart, these lines would change according to the displayed data. User also has the option to lock this in which case if the user scrolls back, then these SD lines will not change.
Question: Is this possible to develop this on Ninjatrader? Would this require custom development?
On Bloomberg Terminal, there is a standard indicator called "Range Average SD Bands"...SD stands for Standard Deviation Bands.
Basically the idea is that for any price chart, there will be a horizontal line for "Average" and 2 horizontal lines above the average for Average + 1 Standard Deviation and Average + 2 Standard Deviation. Likewise there will be 2 horizontal lines below for the average for Average - 1 Standard Deviation and Average - 2 Standard Deviation.
Also, all these lines are color coded differently. In addition, these lines are constantly calculated and displayed on the screen. User also has the following options:
1) To determine how many bars to look back to calculate this Standard Deviations
2) By default, if the user were to scroll back on the chart, these lines would change according to the displayed data. User also has the option to lock this in which case if the user scrolls back, then these SD lines will not change.
Question: Is this possible to develop this on Ninjatrader? Would this require custom development?

Comment