Announcement

Collapse
No announcement yet.

Partner 728x90

Collapse

Bid/ask charting

Collapse
X
 
  • Filter
  • Time
  • Show
Clear All
new posts

    Bid/ask charting

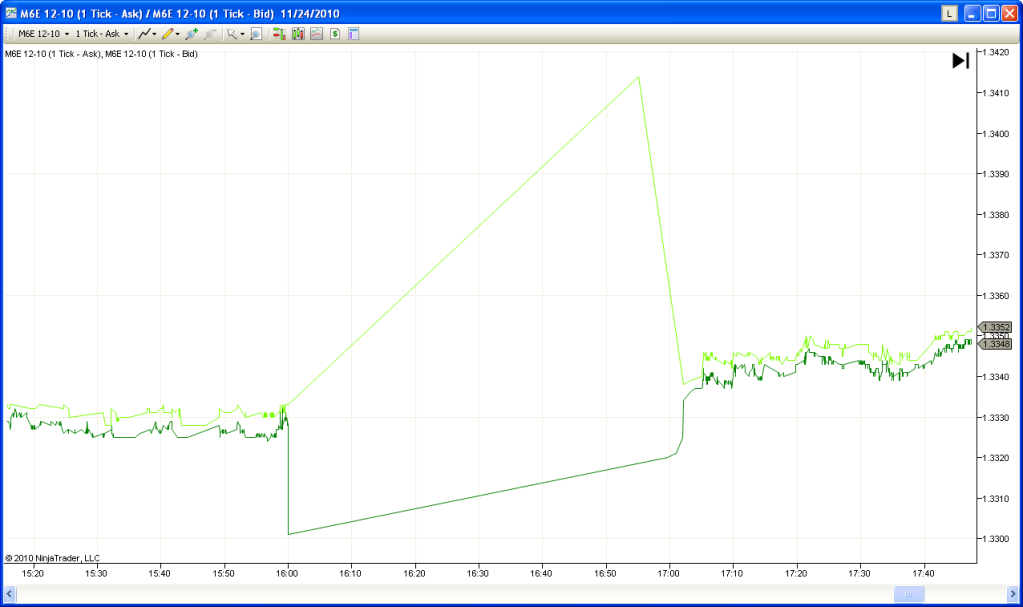
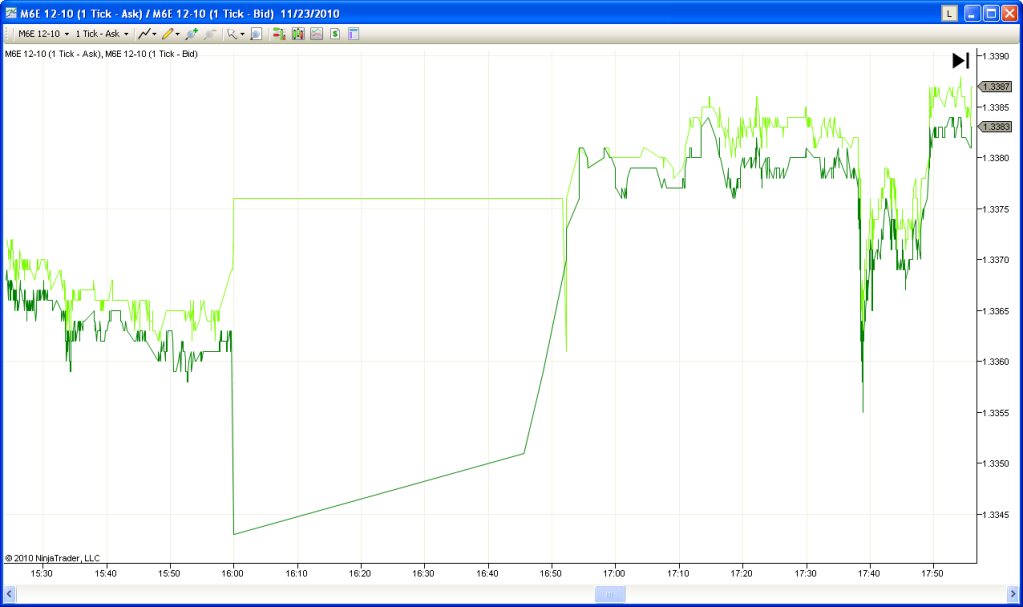
    Is there a way to get a tick or range chart to display the bid and ask prices instead of the last traded price??


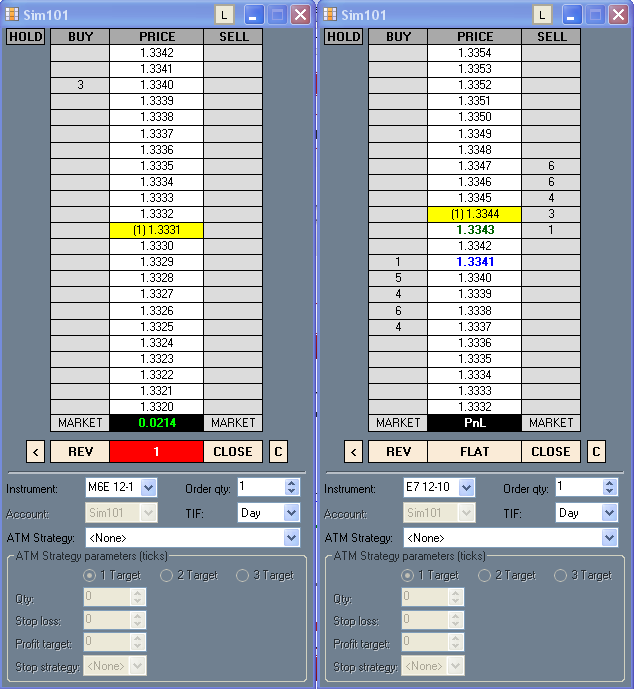
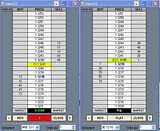
    As you can see from the following DOM screen captures (M6E on the left, and E7 on the right) , hugely aberrant behavior can result of the wacky spreads on the M6E and last traded price disparity. Talk about a strategy buster!!!

    Note that you can't even see the ask price on M6E on this first shot taken at 5:15:22PM today. The M6E is 13 ticks away from the E7 last traded price. You can't even adjust the DOM to see what is going on here!!!


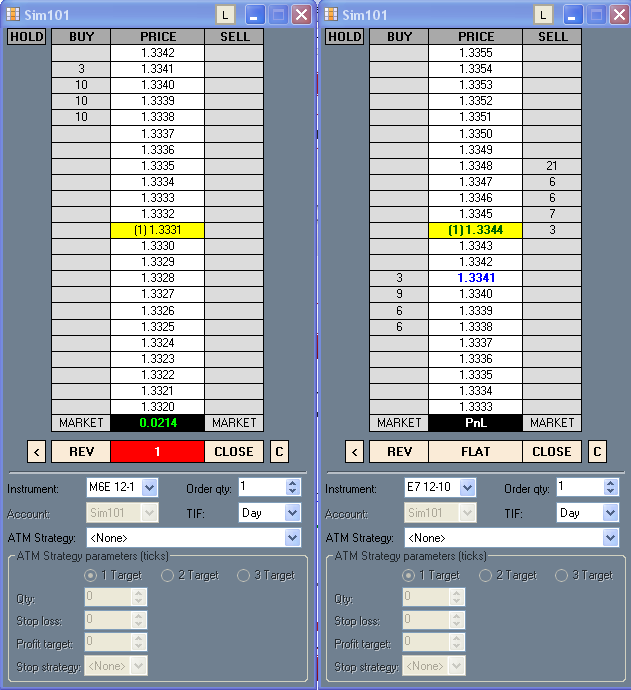
    taken at 5:15:56PM today


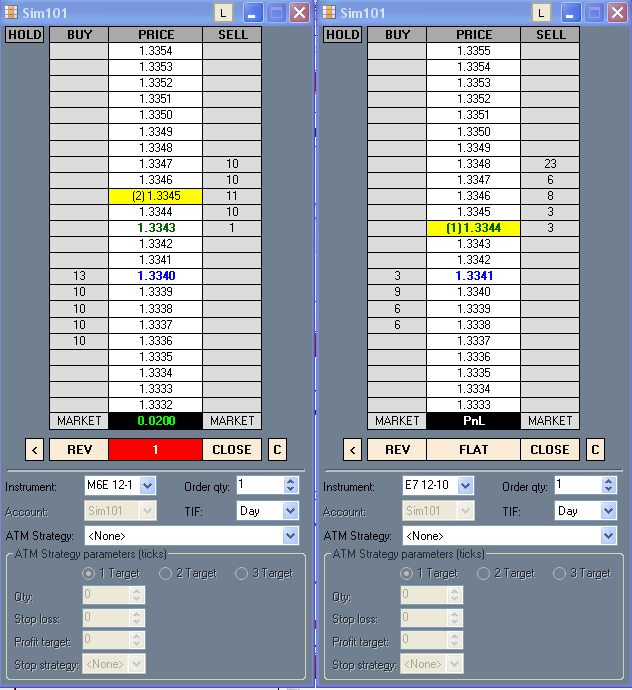
    taken at 5:17:15PM today - all of a sudden boom! the LTP jumps 14 ticks! No inbetween ticks, just took a quantum leap higher.


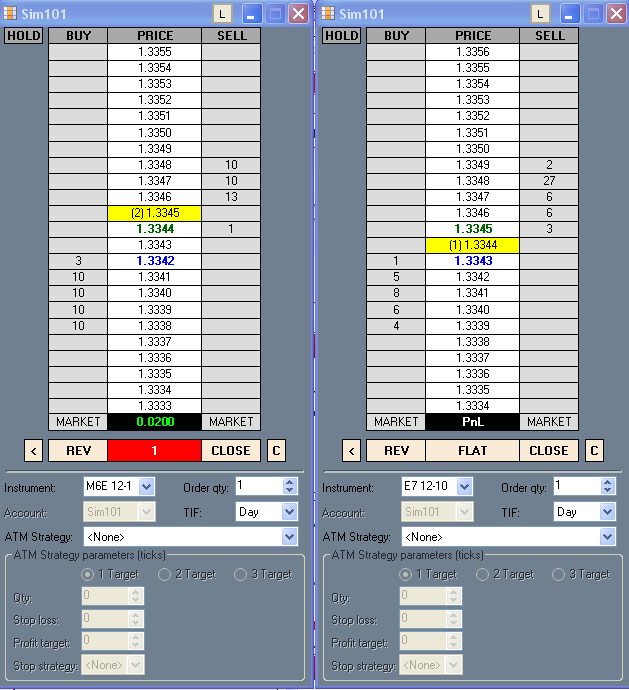
    taken at 5:19:12PM today


    Is there any way to replay this data on NT7 through my PFG feed? I would record a video of the oddity if I can.
    Last edited by RDPoS; 11-24-2010, 10:15 PM. Reason: time update

    #2
    Hello RDPoS,

    Very interesting post!

    One of the main things you have already recognized it that these Euro-mini contracts don’t yet have a huge amount of open interest so they are currently a little “liquidity-challenged” if you will. It’s the same as trying to trade an illiquid stock – there will be larger spreads & the next traded price has the potential to take place some distance away from the last traded price. These markets are usually more profitably approached by the broker-side in that unless significant directional volatility is manifested (and you’re on the right side) – you’re better off “booking the spread”.

    You can plot the bid & ask price to the chart using NinjaTrader 7. (see screenshot) For example the Nikkei 225 future: I plotted the bid as one data series & the ask as the secondary data series and simply combined them on to the same ‘panel’. Volumes were on the “light” side but the concept is there. I realize it’s not ideal but perhaps it serves as a jumping off point for constructing a spread-type indicator.

    As far as recording & replaying the data, just make sure to implement the recording instructions (for both contracts) and you will be able to play back. Here is the link as a reference (NinjaTrader 7):


    I would also like to hear other forum members comment as well!
    Attached Files
    ChipNinjaTrader Customer Service

    Comment


      #3
      That is a neat little trick to be able to chart those so easily. I noticed some strange behavior and have made a a couple screen shots of it off the M6E It would seem as though it would not be wise to build a strategy off of the bid/ask because of this ballooning when the CME closes for updates unless you just opt out of all orders during that hour, seems kind of dangerous though. Maybe there is a better way.


      Comment


        #4
        I suggest to exclude those times as well when you run your strategy. You can create custom session templates in the Session Manager and subsequently apply it when you run the strategy.

        Unfortunately I do not see another way.
        JasonNinjaTrader Customer Service

        Comment


          #5
          I have an idea crazy enough it just might work!

          We all know the following contracts
          6E - the full EUR/USD Future
          E7 - the mini EUR.USD Future
          M6E - the micro EUR/USD Future

          M6E is kind of illiquid at times (currently sitting at a 5 tick spread as I type at 11:55PM Central Time), thus often rendering stop limit orders useless as the last traded price jumps past your stop a lot.

          All three of these futures track exactly with each other, with the 6E have the tightest spread of them all. Here is a side by side comparison of the two.... (AVI Video of the market action I recorded)


          What if you used the chart of the 6E as the reference to place all of your trades on the M6E? Since the spread is always wider on M6E, your stop limit orders would almost always be filled at least they should be....

          Is there anyway to do this sort of mapping?

          Plot your indicator and strategy on the 6E but have the orders execute on M6E instead?

          It does eliminate the problems of triggering a strategy off of the bid/ask on an illiquid asset.
          Last edited by RDPoS; 11-29-2010, 12:13 AM.

          Comment


            #6
            You can create custom strategies that make use of multiple instruments. Please see the link below for more information.
            JasonNinjaTrader Customer Service

            Comment


              #7
              Pure awesomeness! I just hope my infantile programming skills can translate this tool into a functional reality.

              Comment

              Latest Posts

              Collapse

              Topics Statistics Last Post
              Started by algospoke, Yesterday, 06:40 PM
              2 responses
              19 views
              0 likes
              Last Post algospoke  
              Started by ghoul, Today, 06:02 PM
              3 responses
              14 views
              0 likes
              Last Post NinjaTrader_Manfred  
              Started by jeronymite, 04-12-2024, 04:26 PM
              3 responses
              44 views
              0 likes
              Last Post jeronymite  
              Started by Barry Milan, Yesterday, 10:35 PM
              7 responses
              20 views
              0 likes
              Last Post NinjaTrader_Manfred  
              Started by AttiM, 02-14-2024, 05:20 PM
              10 responses
              180 views
              0 likes
              Last Post jeronymite  
              Working...
              X