
Is there a way of inserting a simple moving average to the MaCD window?
-
Hi Idude,
Thank you for your post.
Yes you can add a SMA to a MACD.
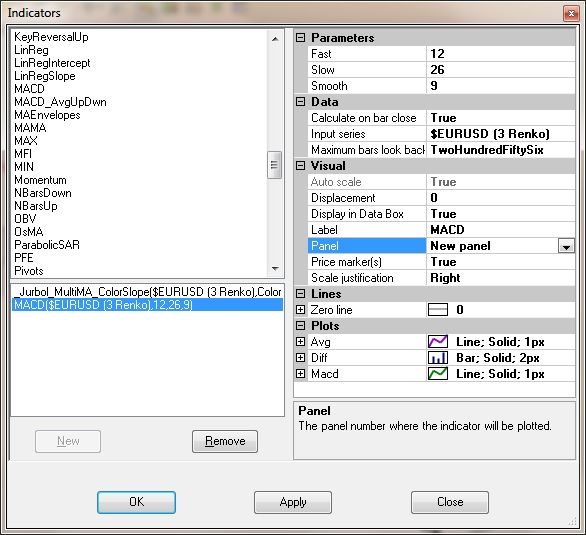
Please follow the steps below -- Right click on the chart and select Indicators...
- Add the MACD and click Apply
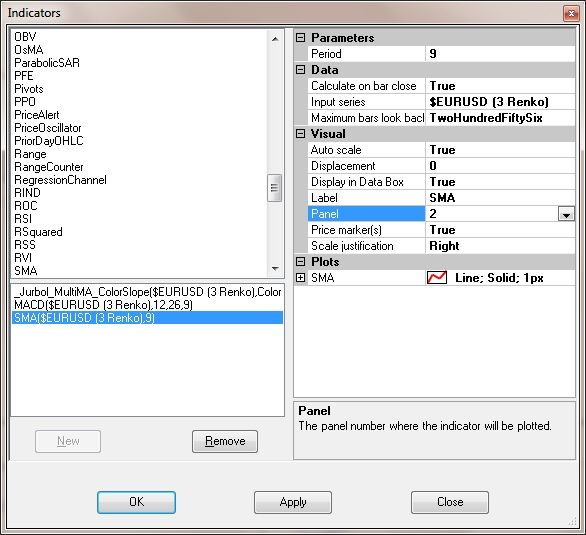
- Add the SMA to the chart
- Select the SMA from the bottom left list after adding it
- Find the parameter to the right called Panel and select 2 or the same panel that the MACD is in.
- If you see a distortion of the SMA and MACD change the Scale Justification for the SMA to either Left or Overlay
Let me know if I can be of further assistance.Cal H.NinjaTrader Customer Service -
Idude,
Can you post screen shots of the settings you have entered for the SMA and MACD?
To send a screenshot press Alt + PRINT SCREEN to take a screen shot of the selected window. Then go to Start--> Accessories--> Paint, and press CTRL + V to paste the image.
Lastly, save as a jpeg file and add as an attachment to your post by clicking reply and Go Advanced. Select the paperclip from the top toolbar to add attachments
For detailed instructions please visit the following link
http://take-a-screenshot.org/Cal H.NinjaTrader Customer ServiceComment
-
Comment
-
Idude,
Thank you for the photos.
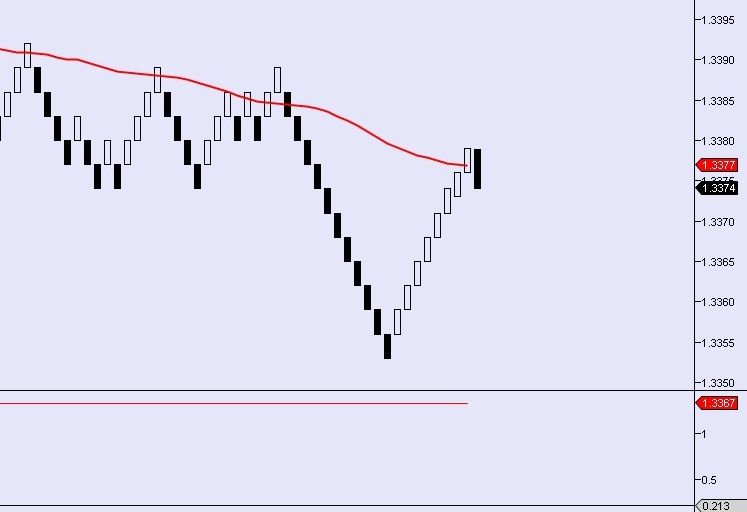
The indicators are being plotted but the scaling is off.
Back in the indicators window, select the SMA from the bottom left list and change the Scale Justification to either Overlay or Left.Cal H.NinjaTrader Customer ServiceComment
-
Cal, below are some screen shots of trying to overlay a 20 SMA on a MACD. The first is from Stockcharts.com, on a 1 minute chart, the second is NinjaTrader's 1 minute chart after following your directions for overlaying a MA onto the MACD.
As you can see, the chart from NT is way off & untradable, while the chart from Stockcharts is a true representation of a 20 SMA applied to a MACD_Histogram, & catches the trend pretty good. Is there a way to duplicate this with NT?Attached FilesComment
-
-
idude,
Thank you for the screenshots.
It looks like you want a moving average of the Histogram of the MACD. No problem.
Follow the steps below to accomplish this -
1. From your chart open the Indicators Window, Right click in the chart and select Indicators
2. If you have’t already add the SMA and MACD Indicators by selecting the indicator on the left list and click new.
3. To the right will be parameters for that Indicator.
4. For the SMA, under ‘Data’ change the Input series by clicking in the field and then the ‘…’ button that appears to the right.
5. This will bring up the Input Series window.
6. Double click Indicators and select the MACD Indicator. Below you can enter in the Parameters of the MACD indicator if you want
7. Change the Plot value to Diff
8. Click OK.
9. Change the plot colors of the MACD to Transparent except for the Histogram plot, by clicking the plus next to the plots to access the colors.
10. Click Apply and then OK
This should get you closer to the stockchart that you are wanting to get to.
Let me know if I can be of further assistance.Cal H.NinjaTrader Customer ServiceComment
-
Applied the suggestions by NinjaTrader_Cal. The indicator on the NinjaTrader charts comes out identical with the one from Stock Charts, see screenshot attached.Attached FilesComment
-
Comment