Announcement

Collapse

Looking for a User App or Add-On built by the NinjaTrader community?

Visit NinjaTrader EcoSystem and our free User App Share!

Have a question for the NinjaScript developer community? Open a new thread in our NinjaScript File Sharing Discussion Forum!
See more
See less

Partner 728x90

Collapse

AddLineBreak() on a diffrent Instrument

Collapse
X
 
  • Filter
  • Time
  • Show
Clear All
new posts

    AddLineBreak() on a diffrent Instrument

    So, here what I want to do:
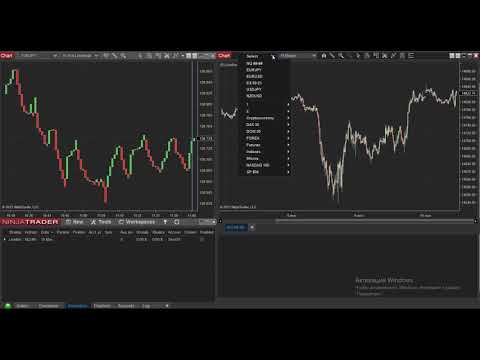
    I want to add LineBreak dataseris from diffrent Instrument to the Strategy. For example, I want to strart the Strategy on NQ##-##, and add LineBreak on EURJPY. Please take a look how I'm doing it:
    PHP Code:
    else if (State == State.Configure)
    {
    AddLineBreak("EURJPY",BarsPeriodType.Tick,75,3,MarketDataType.Last);


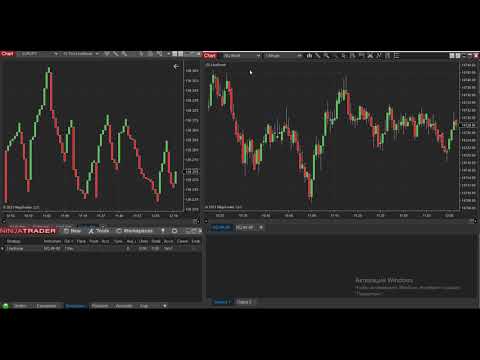
    Then I will place the Strategy on the "NQ##-##" and want to see the candles data from BarsArray[1]. Please take a look:
    PHP Code:
    protected override void OnBarUpdate()
    {
    if (
    CurrentBar 1) return;

    if (
    BarsInProgress == 1)
    Print(
    Times[1][0].ToString("HH:mm:ss.ffff")+", "+
    Opens[1][0].ToString()+", "+
    Closes[1][0].ToString()+" :: "+
    Times[1][1].ToString("HH:mm:ss.ffff")+", "+
    Opens[1][1].ToString()+", "+
    Closes[1][1].ToString()+" :: "+
    BarsArray[1].ToString()
    );

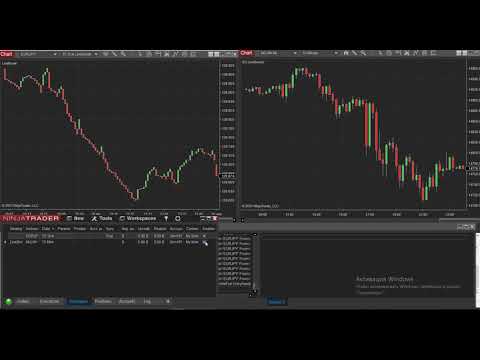
    If I opened the "EURJPY" LineBreak chart (with the same parameters) aditionally, I will see that the Strategy on "NQ##-##" sees NOT the same value as I see it on the "EURJPY" LineBreak chart.
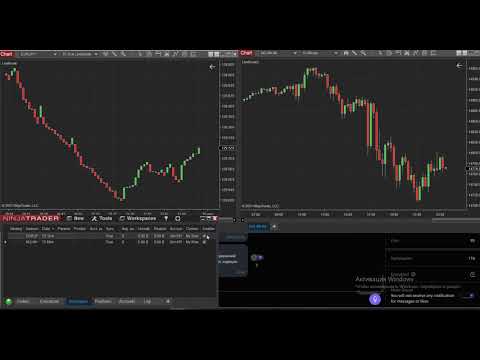
    If I opened the "EURJPY" LineBreak chart (with the same parameters) aditionally and place the Strategy on "EURJPY" chart, I will see that the Strategy on "EURJPY" sees the SAME value as I see it on the "EURJPY" LineBreak chart.

    Why? How I can get the same values?
    Please take a look at the video and Strategy.


    Attached Files

    #2
    Hello webus,

    Thank you for your post.

    In my testing I've added an extra bit to the print you have there to discern which primary series is on the chart when they are running at the same time:

    Code:
    Print(BarsArray[0].Instrument.FullName + " - CurrentBar of Secondary: " +
    CurrentBars[1] + " " +
    Times[1][0].ToString("HH:mm:ss.ffff")+", "+
    Opens[1][0].ToString()+", "+
    Closes[1][0].ToString()+" :: "+
    Times[1][1].ToString("HH:mm:ss.ffff")+", "+
    Opens[1][1].ToString()+", "+
    Closes[1][1].ToString()+" :: "+
    BarsArray[1].ToString()
    );
    Here's what I get when putting an NQ 09-21 and an EURJPY line break series on the same chart and adding 2 instances of the script, one to each data series:


    NQ 09-21 - CurrentBar of Secondary: 3794 11:03:12.9210, 130.793, 130.795 :: 11:02:07.4190, 130.789, 130.793 :: Instrument='EURJPY' From='2021-07-06' To='2021-07-09' period='75 Tick LineBreak' IsTickReplay=False Count='3796' firstTime=7/5/2021 4:00:05.350 PM lastTime=7/9/2021 11:03:40.602 AM
    NQ 09-21 - CurrentBar of Secondary: 3795 11:03:40.6020, 130.795, 130.795 :: 11:03:12.9210, 130.793, 130.795 :: Instrument='EURJPY' From='2021-07-06' To='2021-07-09' period='75 Tick LineBreak' IsTickReplay=False Count='3796' firstTime=7/5/2021 4:00:05.350 PM lastTime=7/9/2021 11:03:40.602 AM

    EURJPY - CurrentBar of Secondary: 3794 11:03:12.9210, 130.793, 130.795 :: 11:02:07.4190, 130.789, 130.793 :: Instrument='EURJPY' From='2021-07-06' To='2021-07-09' period='75 Tick LineBreak' IsTickReplay=False Count='3796' firstTime=7/5/2021 4:00:05.350 PM lastTime=7/9/2021 11:03:40.602 AM
    EURJPY - CurrentBar of Secondary: 3795 11:03:40.6020, 130.795, 130.795 :: 11:03:12.9210, 130.793, 130.795 :: Instrument='EURJPY' From='2021-07-06' To='2021-07-09' period='75 Tick LineBreak' IsTickReplay=False Count='3796' firstTime=7/5/2021 4:00:05.350 PM lastTime=7/9/2021 11:03:40.602 AM

    You'll see the prints here have identical values.

    I'm not able to replicate them having different values, however.

    Do you see the same when testing in a similar fashion?

    Thanks in advance; I look forward to assisting you further.
    Kate W.NinjaTrader Customer Service

    Comment


      #3
      Hi NinjaTrader_Kate,

      1.
      In my testing I've added an extra bit to the print you have there to discern which primary series is on the chart when they are running at the same time:
      Got it. Your life - your rules. OK.

      2.
      You'll see the prints here have identical values.
      I'm not able to replicate them having different values, however.
      Do you see the same when testing in a similar fashion?
      I don’t understand why you don’t like my code and test in video, but I tried with your extra log line - and my results are the same as before. The data is different. Also, thanks for your line, I discovered another NT8 bug. I will explain this below.
      I was able to get correct results on the weekend when the market was closed. But I'm doing the test now once again - please take a look at my video and log files (.zip).


      3. The Bug#2:
      When the Strategy start the State.Realtime we see this line:
      PHP Code:
      Enabling NinjaScript strategy 'LineBreak/236500567' On starting a real-time strategy StartBehavior=WaitUntilFlat EntryHandling=All entries EntriesPerDirection=1 StopTargetHandling=Per entry execution ErrorHandling=Stop strategycancel ordersclose positions ExitOnSessionClose=True triggering 30 seconds before close SetOrderQuantityBy=Strategy ConnectionLossHandling=Recalculate DisconnectDelaySeconds=10 CancelEntriesOnStrategyDisable=False CancelExitsOnStrategyDisable=False Calculate=On each tick IsUnmanaged=False MaxRestarts=4 in 5 minutes 
      Afrer this line I see:
      PHP Code:
      NQ ##-## - CurrentBar of Secondary: 4051 11:48:31.2200, 130.729, 130.733 :: 11:47:57.9300, 130.712, 130.729 :: Instrument='EURJPY' From='2021-07-06' To='2021-07-12' period='75 Tick LineBreak' Count='4053' firstTime=06.07.2021 1:00:17.620 lastTime=12.07.2021 11:48:38.017
      NQ ##-## - CurrentBar of Secondary: 4052 11:48:38.0170, 130.733, 130.735 :: 11:48:31.2200, 130.729, 130.733 :: Instrument='EURJPY' From='2021-07-06' To='2021-07-12' period='75 Tick LineBreak' Count='4053' firstTime=06.07.2021 1:00:17.620 lastTime=12.07.2021 11:48:38.017
      NQ ##-## - CurrentBar of Secondary: 4051 11:48:31.2200, 130.729, 130.733 :: 11:47:57.9300, 130.712, 130.729 :: Instrument='EURJPY' From='2021-07-06' To='2021-07-12' period='75 Tick LineBreak' Count='4053' firstTime=06.07.2021 1:00:17.620 lastTime=12.07.2021 11:48:38.026
      NQ ##-## - CurrentBar of Secondary: 4052 11:48:38.0260, 130.733, 130.735 :: 11:48:31.2200, 130.729, 130.733 :: Instrument='EURJPY' From='2021-07-06' To='2021-07-12' period='75 Tick LineBreak' Count='4053' firstTime=06.07.2021 1:00:17.620 lastTime=12.07.2021 11:48:38.026
      NQ ##-## - CurrentBar of Secondary: 4051 11:48:31.2200, 130.729, 130.733 :: 11:47:57.9300, 130.712, 130.729 :: Instrument='EURJPY' From='2021-07-06' To='2021-07-12' period='75 Tick LineBreak' Count='4053' firstTime=06.07.2021 1:00:17.620 lastTime=12.07.2021 11:48:38.257
      NQ ##-## - CurrentBar of Secondary: 4052 11:48:38.2570, 130.733, 130.735 :: 11:48:31.2200, 130.729, 130.733 :: Instrument='EURJPY' From='2021-07-06' To='2021-07-12' period='75 Tick LineBreak' Count='4053' firstTime=06.07.2021 1:00:17.620 lastTime=12.07.2021 11:48:38.257
      NQ ##-## - CurrentBar of Secondary: 4051 11:48:31.2200, 130.729, 130.733 :: 11:47:57.9300, 130.712, 130.729 :: Instrument='EURJPY' From='2021-07-06' To='2021-07-12' period='75 Tick LineBreak' Count='4053' firstTime=06.07.2021 1:00:17.620 lastTime=12.07.2021 11:48:38.573
      NQ ##-## - CurrentBar of Secondary: 4052 11:48:38.5730, 130.733, 130.735 :: 11:48:31.2200, 130.729, 130.733 :: Instrument='EURJPY' From='2021-07-06' To='2021-07-12' period='75 Tick LineBreak' Count='4053' firstTime=06.07.2021 1:00:17.620 lastTime=12.07.2021 11:48:38.573
      NQ ##-## - CurrentBar of Secondary: 4051 11:48:31.2200, 130.729, 130.733 :: 11:47:57.9300, 130.712, 130.729 :: Instrument='EURJPY' From='2021-07-06' To='2021-07-12' period='75 Tick LineBreak' Count='4053' firstTime=06.07.2021 1:00:17.620 lastTime=12.07.2021 11:48:39.134
      NQ ##-## - CurrentBar of Secondary: 4052 11:48:39.1340, 130.733, 130.734 :: 11:48:31.2200, 130.729, 130.733 :: Instrument='EURJPY' From='2021-07-06' To='2021-07-12' period='75 Tick LineBreak' Count='4053' firstTime=06.07.2021 1:00:17.620 lastTime=12.07.2021 11:48:39.134 
      This is nonsense. CurrentBar of Secondary: 4051, then CurrentBar of Secondary: 4052, then CurrentBar of Secondary: 4051 - wat?
      Question:
      Can you please explain me that case?
      Attached Files
      Last edited by webus; 07-12-2021, 03:12 AM. Reason: typos

      Comment


        #4
        Hello webus,

        Thank you for your reply.

        What you're seeing in #2 is not a bug, it's expected. Line Break bars use RemoveLastBar() to remove the last data point and update the prior bar with new values. That's why you see the 4051 > 4052 > 4051 - it's processing the previous bar again.


        Please let us know if we may be of further assistance to you.
        Kate W.NinjaTrader Customer Service

        Comment


          #5
          Hi NinjaTrader_Kate,

          Originally posted by NinjaTrader_Kate View Post
          Hello webus,

          Thank you for your reply.

          What you're seeing in #2 is not a bug, it's expected. Line Break bars use RemoveLastBar() to remove the last data point and update the prior bar with new values. That's why you see the 4051 > 4052 > 4051 - it's processing the previous bar again.


          Please let us know if we may be of further assistance to you.
          Yes, I need further assistance. What about my main question? Please take a look at point2 above (explanation, video#2, log files).

          Comment


            #6
            Hello webus,

            Thank you for your reply.

            As far as not seeing matching data, we need to be sure you're comparing apples to apples here.

            That would be best done by:

            1. having the same script print to output tab 1 and output tab 2 depending on the primary instrument using PrintTo: 2. make sure the data series has the same starting point, using Break at EOD since we are working with tick based data. Also make sure Days To Load is set to 1 to make the test more succinct.
            3. add the strategies to EURJPY LineBreak chart, and NQ chart
            4. select both strategies from control center, then enable both at the same time by right click > enable

            If you're comparing the same data, you should see the same prints for the secondary series.

            Please let us know if we may be of further assistance to you.
            Kate W.NinjaTrader Customer Service

            Comment


              #7
              Hi NinjaTrader_Kate,

              Originally posted by NinjaTrader_Kate View Post
              Hello webus,

              Thank you for your reply.

              As far as not seeing matching data, we need to be sure you're comparing apples to apples here.

              That would be best done by:

              1. having the same script print to output tab 1 and output tab 2 depending on the primary instrument using PrintTo:
              2. make sure the data series has the same starting point, using Break at EOD since we are working with tick based data. Also make sure Days To Load is set to 1 to make the test more succinct.
              3. add the strategies to EURJPY LineBreak chart, and NQ chart
              4. select both strategies from control center, then enable both at the same time by right click > enable

              If you're comparing the same data, you should see the same prints for the secondary series.

              Please let us know if we may be of further assistance to you.
              1. Sorry, but I do not understand what kind of quest you are offering me. Here's my question:
              Did you see my code? It is nowhere easier, what exactly do you want to be convinced of? It is static and does not change in any way. It just prints out the data from the LineBreak chart ("EURJPY", BarsPeriodType.Tick, 75.3, MarketDataType.Last). Have you watched my video? Have you looked at my logs?

              Here's my main question:
              Why does LineBreak chart data ("EURJPY", BarsPeriodType.Tick, 75,3, MarketDataType.Last) differ from the same source code? Why do I see correct data if I place an example of a Strategy on ANY "EURJPY" chart and incorrect data if I place it on ANY other chart?

              2.
              2. make sure the data series has the same starting point, using Break at EOD since we are working with tick based data. Also make sure Days To Load is set to 1 to make the test more succinct.
              3. add the strategies to EURJPY LineBreak chart, and NQ chart
              4. select both strategies from control center, then enable both at the same time by right click > enable
              I don't understand these complexities. Is this the expected behavior? I want to receive the same data at any time, from any chart. Based on this data, I want to build a Strategy. I do not want to see any random data, I want to see the same data that I see visually on the chart. Is this a problem?

              Again. I see correct, expected data if I start my example Strategy on ANY EURJPY chart. I want to see the same data from ANY other chart. Are we on the same page?
              Last edited by webus; 07-12-2021, 01:49 PM.

              Comment


                #8
                Hello webus,

                Thank you for your reply.

                I've created a short demonstration video showing the same values being retrieved by printing those values when applied to both a EURJPY chart and an NQ ##-## chart.

                I am seeing identical values in my testing here. If you test in the same manner, you should see identical values. I've attached the two scripts I used for testing as well.

                Free online storage and sharing with Screencast.com. 2 GB of storage and 2 GB of bandwidth per month for free. We won't compress, alter or take ownership of your content.


                Keep in mind that because line break charts use RemoveLastBar, which cannot be simulated historically, any strategy based on these will not give accurate results in a historical backtest using the Strategy Analyzer or on a chart. For this reason, I've focused my test on real time data only. It should be noted that other means of testing, such as in Playback using Market Replay data, can yield more accurate results.

                Please let us know if we may be of further assistance to you.
                Attached Files
                Kate W.NinjaTrader Customer Service

                Comment


                  #9
                  Hi NinjaTrader_Kate,

                  Originally posted by NinjaTrader_Kate View Post
                  Hello webus,

                  Thank you for your reply.

                  I've created a short demonstration video showing the same values being retrieved by printing those values when applied to both a EURJPY chart and an NQ ##-## chart.

                  I am seeing identical values in my testing here. If you test in the same manner, you should see identical values. I've attached the two scripts I used for testing as well.

                  Free online storage and sharing with Screencast.com. 2 GB of storage and 2 GB of bandwidth per month for free. We won't compress, alter or take ownership of your content.


                  Keep in mind that because line break charts use RemoveLastBar, which cannot be simulated historically, any strategy based on these will not give accurate results in a historical backtest using the Strategy Analyzer or on a chart. For this reason, I've focused my test on real time data only. It should be noted that other means of testing, such as in Playback using Market Replay data, can yield more accurate results.

                  Please let us know if we may be of further assistance to you.
                  Actually thanks for really trying to help me!

                  1.
                  I've created a short demonstration video showing the same values being retrieved by printing those values when applied to both a EURJPY chart and an NQ ##-## chart.
                  I am seeing identical values in my testing here. If you test in the same manner, you should see identical values. I've attached the two scripts I used for testing as well.
                  I think that I do not understand the test. You used AddRenko (AddRenko("EURJPY", 4, MarketDataType.Last)), and you received the data from Renko, not LineBreak chart.
                  I what to add LineBreak dataseries (AddLineBreak("EURJPY", BarsPeriodType.Tick, 75, 3, MarketDataType.Last)) and I want to receive data from LineBreak chart. This is a critical misunderstanding. Here is what you are doing:
                  - you added AddRenko EURJPYdataseries.
                  - you opened LineBreak chart and read the Renko chart data
                  What I want to do:
                  - I want to add AddLineBreak EURJPYdataseries.
                  - I want to open ANY chart (for example M15) from ANY instrument and get the correct data from EURJPY LineBreak chart.
                  - the data for EURJPY LineBreak should be the same from any chart

                  Are we on the same page in this? Can you make this test on your side? Please let me know if you have any question in this. This is a keypoint for issue.


                  2. OK, I will try to clarify the problem in another example. Please keep in mind that it is just an example for better understanding the problem.
                  want to create a Strategy, which I will start on EURUSD M1 chart. The trading logic will be based on the SMA(5) and SMA(20) from EURJPY LineBreak chart. So, Long for EURUSD signal -> SMA(5) crossed SMA(20) upwards on the EURJPY LineBreak chart, Short signal for EURUSD -> SMA(5) crossed SMA(20) downwards on the EURJPY LineBreak chart.

                  THE PROBLEM:
                  If I additionally open the EURJPY LineBreak chart and place SMA(5) and SMA(20) on it (to check the Strategy on the EURUSD M1), then their data will not coincide with what the Strategy on the EURUSD M1 sees.

                  BUT:
                  If I start the Strategy not on EURUSD M1, but on the EURJPY M1 and If I additionally open the EURJPY LineBreak chart and place SMA(5) and SMA(20) on it (to check the Strategy on the EURJPY M1), then their data will be coincide with what the Strategy on the EURJPY M1 sees.

                  Question:
                  Do you see the problem?


                  3.
                  Keep in mind that because line break charts use RemoveLastBar, which cannot be simulated historically, any strategy based on these will not give accurate results in a historical backtest using the Strategy Analyzer or on a chart.
                  But after all, I get the correct result on historical data (data that coincides with what I see on the lineBreak chart) if I run my example on any EURJPY chart. Is there an explanation for this? What is the difference? Why don't I get the same result if I place the same strategy on another instrument?

                  Comment


                    #10
                    Hello webus,

                    Thank you for your reply.

                    Ah, thanks for catching that. I've repeated the same test again, this time using the line break series - you can comment out the renko series in those scripts and uncomment the line break series to mimic this test:

                    Free online storage and sharing with Screencast.com. 2 GB of storage and 2 GB of bandwidth per month for free. We won't compress, alter or take ownership of your content.


                    You'll see the data returned is the same.

                    Would you be able to provide a sample script to reproduce the issue you're seeing with the SMAs? Are you starting the two at the same time so they are iterating over the exact same real time data?

                    Thanks in advance; I look forward to assisting you further.

                    Kate W.NinjaTrader Customer Service

                    Comment


                      #11
                      Hi NinjaTrader_Kate,

                      1.
                      You'll see the data returned is the same.
                      Yes, true. But I do not understand why your way is working, but my - not. What is the key point and why? What I am doing wrong?
                      Please take a look:


                      2.
                      Are you starting the two at the same time so they are iterating over the exact same real time data?
                      I think this can be a key point. Why should I start it at the same time?

                      3. Ok, please focus on this explanation.
                      a. I want to add the "AddLineBreak("EURJPY", BarsPeriodType.Tick, 75, 3, MarketDataType.Last)" in the Strategy.
                      b. I want to start the Strategy on the EURUSD M15 (for example! the key - this chart should be not the same as in p#a above).
                      c. I want the strategy to get the same data as I will see if I open the LineBreak EURJPY chart.

                      So, I want to start the Strategy on EURUSD M15, I do not want to open the LineBreak EURJPY aditionally, but I have to, because I want to check if the Strategy sees what I see on the LineBreak EURJPY. Do you understand what I mean?
                      I expect the Strategy to programmatically see exactly the same chart as if I opened it manually. Is this a problem?

                      3.
                      Would you be able to provide a sample script to reproduce the issue you're seeing with the SMAs? Are you starting the two at the same time so they are iterating over the exact same real time data?
                      But this is obvious. The MA lines are drawn according to the candles data. If the candles that the Strategy sees do not coincide with the candles that I see on the chart - the lines will be different, right? Please take a look at my next video example. If necessary, I will send the source code, but it is simple (I believe).

                      Comment


                        #12
                        Hello webus,

                        Thank you for your reply.

                        It's right about the end of my day today, and I'll need some time to look over what you've provided to give a thorough answer. I'll get that to you tomorrow. In the meantime, if you could please provide your example script that replicates what you're seeing with the SMAs.

                        Thanks in advance; I look forward to assisting you further.
                        Kate W.NinjaTrader Customer Service

                        Comment


                          #13
                          Hi NinjaTrader_Kate,

                          It's right about the end of my day today, and I'll need some time to look over what you've provided to give a thorough answer. I'll get that to you tomorrow. In the meantime, if you could please provide your example script that replicates what you're seeing with the SMAs.
                          Yes, please take a look. Do not forget to check out my videos from the previous post.
                          Attached Files

                          Comment


                            #14
                            Hello webus,

                            Thank you for your patience.

                            In your videos you are using BarsToLoad.

                            You should understand that the chart data series and the data series you're adding in the strategy are different and that with tick based bars, you are going to get different results depending on whether you are using Bars to Load vs Days to Load and if Break at EOD is checked. Break at EOD should be checked for consistency with tick based bars and we should have enough data loaded to load more than one session (best to use Days To Load) so the tick based bars break at the end of the session and build from the same session break. Loading 500 bars on the EURJPY chart and 5 days of data on the NQ chart would be expected to give different results. You need to load the same amount of data on both to see the same results.

                            Please let us know if we may be of further assistance to you.
                            Kate W.NinjaTrader Customer Service

                            Comment

                            Latest Posts

                            Collapse

                            Topics Statistics Last Post
                            Started by ghoul, Today, 06:02 PM
                            1 response
                            10 views
                            0 likes
                            Last Post NinjaTrader_Manfred  
                            Started by jeronymite, 04-12-2024, 04:26 PM
                            3 responses
                            44 views
                            0 likes
                            Last Post jeronymite  
                            Started by Barry Milan, Yesterday, 10:35 PM
                            7 responses
                            20 views
                            0 likes
                            Last Post NinjaTrader_Manfred  
                            Started by AttiM, 02-14-2024, 05:20 PM
                            10 responses
                            180 views
                            0 likes
                            Last Post jeronymite  
                            Started by DanielSanMartin, Yesterday, 02:37 PM
                            2 responses
                            13 views
                            0 likes
                            Last Post DanielSanMartin  
                            Working...
                            X