Announcement

Collapse

Looking for a User App or Add-On built by the NinjaTrader community?

Visit NinjaTrader EcoSystem and our free User App Share!

Have a question for the NinjaScript developer community? Open a new thread in our NinjaScript File Sharing Discussion Forum!
See more
See less

Partner 728x90

Collapse

o Compute the Median-Average Adaptive Filter

Collapse
X
 
  • Filter
  • Time
  • Show
Clear All
new posts

    o Compute the Median-Average Adaptive Filter

    hi

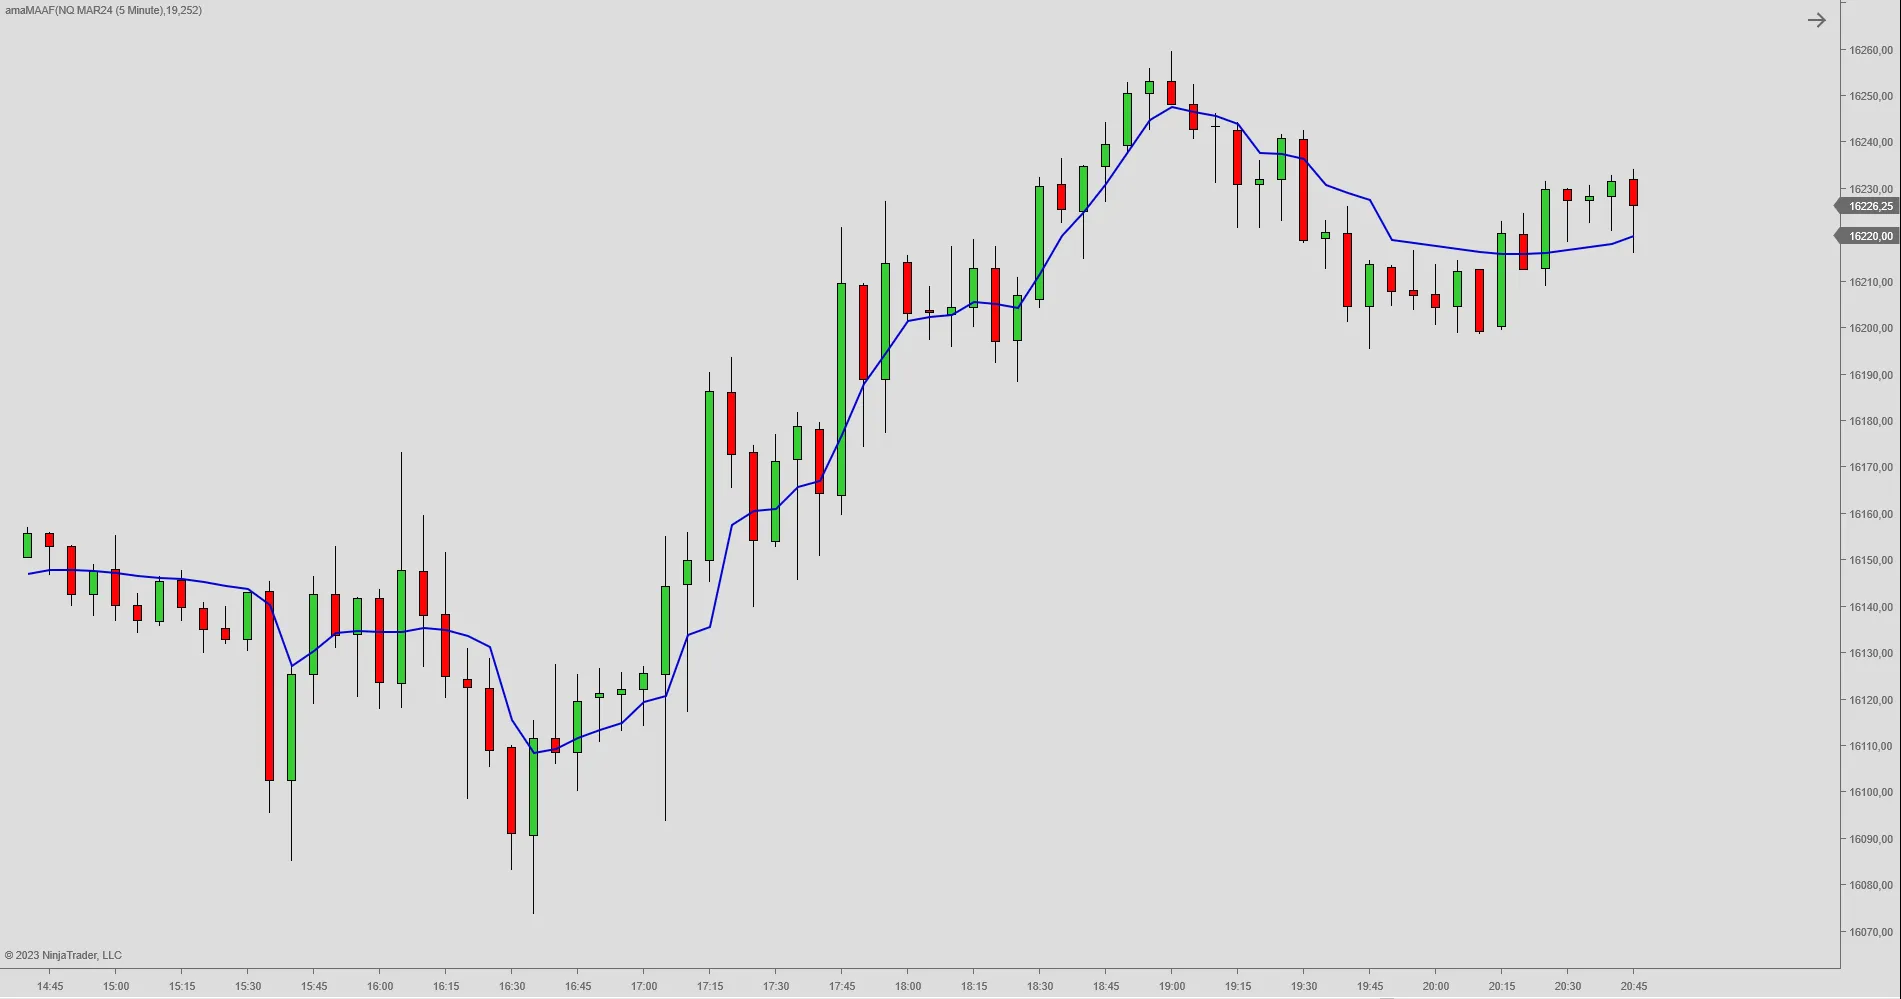
    i am trying to code http://www.stockspotter.com/Files/wh...difference.pdf

    so far i have coded :

    Code:
    #region Using declarations
    using System;
    using System.Collections.Generic;
    using System.ComponentModel;
    using System.ComponentModel.DataAnnotations;
    using System.Linq;
    using System.Text;
    using System.Threading.Tasks;
    using System.Windows;
    using System.Windows.Input;
    using System.Windows.Media;
    using System.Xml.Serialization;
    using NinjaTrader.Cbi;
    using NinjaTrader.Gui;
    using NinjaTrader.Gui.Chart;
    using NinjaTrader.Gui.SuperDom;
    using NinjaTrader.Gui.Tools;
    using NinjaTrader.Data;
    using NinjaTrader.NinjaScript;
    using NinjaTrader.Core.FloatingPoint;
    using NinjaTrader.NinjaScript.DrawingTools;
    #endregion
    
    //This namespace holds Indicators in this folder and is required. Do not change it. 
    namespace NinjaTrader.NinjaScript.Indicators
    {
    	public class JEMEDIANAVARAGE2005TASC : Indicator
    	{
    		private Series<double>	Price;
    		private Series<double>	Smooth;
    		private double Value0;
    		private double Value1;
    		private Series<double> Value2;
    		private double Value3;
    		private double alpha;
    		
    		protected override void OnStateChange()
    		{
    			if (State == State.SetDefaults)
    			{
    				Description									= @"Enter the description for your new custom Indicator here.";
    				Name										= "JEMEDIANAVARAGE2005TASC";
    				Calculate									= Calculate.OnBarClose;
    				IsOverlay									= true;
    				DisplayInDataBox							= true;
    				DrawOnPricePanel							= true;
    				DrawHorizontalGridLines						= true;
    				DrawVerticalGridLines						= true;
    				PaintPriceMarkers							= true;
    				ScaleJustification							= NinjaTrader.Gui.Chart.ScaleJustification.Right;
    				//Disable this property if your indicator requires custom values that cumulate with each new market data event. 
    				//See Help Guide for additional information.
    				IsSuspendedWhileInactive					= true;
    				Length					= 39;
    				Threshold					= 0.002;
    				AddPlot(Brushes.DarkKhaki, "JEFilt");
    			}
    			else if (State == State.Configure)
    			{
    			}
    		}
    
    		protected override void OnBarUpdate()
    		{
    			//Add your custom indicator logic here.
    			/* Inputs: Price((H+L)/2),
    Threshold(.002);
    Vars: Smooth(0),
    Length(30),
    alpha(0),
    Filt(0);
    Smooth = (Price + 2*Price[1] + 2*Price[2] + Price[3]) / 6;
    Length = 39;
    Value3 = .2;
    While Value3 > Threshold begin
    alpha = 2 / (Length + 1);
    Value1 = Median(Smooth, Length);
    Value2 = alpha*Smooth + (1 - alpha)*Value2[1];
    If Value1 <> 0 then Value3 = AbsValue(Value1 - Value2) / Value1;
    Length = Length - 2;
    End;
    If Length < 3 then Length = 3;
    alpha = 2 / (Length + 1);
    Filt = alpha*Smooth + (1 - alpha)*Filt[1];
    Plot1(Filt);*/
    
    			Price[0]=(High[0]+Low[0])/2;
    			Value3 = 0.2;
    			Smooth[0] = (Price[0] + 2*Price[1] + 2*Price[2] + Price[3]) / 6;		
    			
    			while (Value3 > Threshold)
    			{
    			alpha = 2 / (Length + 1);
    			Value1 = Median(Smooth, Length)[0];
    			Value2[0] = alpha*Smooth[0] + (1 - alpha)*Value2[1];
    			if( Value1 != 0) 
    				{
    				Value3 = Abs(Value1 - Value2[0]) / Value1;
    			    }
    			Length = Length - 2;
    			}


    		}
    
    		#region Properties
    		[NinjaScriptProperty]
    		[Range(1, double.MaxValue)]
    		[Display(Name="Length", Order=1, GroupName="Parameters")]
    		public double Length
    		{ get; set; }
    
    		[NinjaScriptProperty]
    		[Range(1E-05, double.MaxValue)]
    		[Display(Name="Threshold", Order=2, GroupName="Parameters")]
    		public double Threshold
    		{ get; set; }
    
    		[Browsable(false)]
    		[XmlIgnore]
    		public Series<double> JEFilt
    		{
    			get { return Values[0]; }
    		}
    		#endregion
    
    	}
    }
    
    #region NinjaScript generated code. Neither change nor remove.
    
    namespace NinjaTrader.NinjaScript.Indicators
    {
    	public partial class Indicator : NinjaTrader.Gui.NinjaScript.IndicatorRenderBase
    	{
    		private JEMEDIANAVARAGE2005TASC[] cacheJEMEDIANAVARAGE2005TASC;
    		public JEMEDIANAVARAGE2005TASC JEMEDIANAVARAGE2005TASC(double length, double threshold)
    		{
    			return JEMEDIANAVARAGE2005TASC(Input, length, threshold);
    		}
    
    		public JEMEDIANAVARAGE2005TASC JEMEDIANAVARAGE2005TASC(ISeries<double> input, double length, double threshold)
    		{
    			if (cacheJEMEDIANAVARAGE2005TASC != null)
    				for (int idx = 0; idx < cacheJEMEDIANAVARAGE2005TASC.Length; idx++)
    					if (cacheJEMEDIANAVARAGE2005TASC[idx] != null && cacheJEMEDIANAVARAGE2005TASC[idx].Length == length && cacheJEMEDIANAVARAGE2005TASC[idx].Threshold == threshold && cacheJEMEDIANAVARAGE2005TASC[idx].EqualsInput(input))
    						return cacheJEMEDIANAVARAGE2005TASC[idx];
    			return CacheIndicator<JEMEDIANAVARAGE2005TASC>(new JEMEDIANAVARAGE2005TASC(){ Length = length, Threshold = threshold }, input, ref cacheJEMEDIANAVARAGE2005TASC);
    		}
    	}
    }
    
    namespace NinjaTrader.NinjaScript.MarketAnalyzerColumns
    {
    	public partial class MarketAnalyzerColumn : MarketAnalyzerColumnBase
    	{
    		public Indicators.JEMEDIANAVARAGE2005TASC JEMEDIANAVARAGE2005TASC(double length, double threshold)
    		{
    			return indicator.JEMEDIANAVARAGE2005TASC(Input, length, threshold);
    		}
    
    		public Indicators.JEMEDIANAVARAGE2005TASC JEMEDIANAVARAGE2005TASC(ISeries<double> input , double length, double threshold)
    		{
    			return indicator.JEMEDIANAVARAGE2005TASC(input, length, threshold);
    		}
    	}
    }
    
    namespace NinjaTrader.NinjaScript.Strategies
    {
    	public partial class Strategy : NinjaTrader.Gui.NinjaScript.StrategyRenderBase
    	{
    		public Indicators.JEMEDIANAVARAGE2005TASC JEMEDIANAVARAGE2005TASC(double length, double threshold)
    		{
    			return indicator.JEMEDIANAVARAGE2005TASC(Input, length, threshold);
    		}
    
    		public Indicators.JEMEDIANAVARAGE2005TASC JEMEDIANAVARAGE2005TASC(ISeries<double> input , double length, double threshold)
    		{
    			return indicator.JEMEDIANAVARAGE2005TASC(input, length, threshold);
    		}
    	}
    }
    
    #endregion
    i have no idea how to code the "median" and "absolute" mentioned in the documents .

    please revert us for the same so that i can calculate this median as ninja based median is calculated on price rather than that on "Smooth"

    thanks for understanding me ....

    thanks in advance
    Last edited by sumana.m; 01-28-2017, 12:24 PM.

    #2
    Hello sumana.m,

    While in general our NinjaScript support is not able to assist with non-NinjaScript code, I did take a look at the document.

    In the context, my guess is that Median is the median of the bar and AbsValue is the absolute value (meaning non negative).
    Median[0]
    Math.Abs(-5);

    Chelsea B.NinjaTrader Customer Service

    Comment


      #3
      Originally posted by NinjaTrader_ChelseaB View Post
      Hello sumana.m,

      While in general our NinjaScript support is not able to assist with non-NinjaScript code, I did take a look at the document.

      In the context, my guess is that Median is the median of the bar and AbsValue is the absolute value (meaning non negative).
      Median[0]
      Math.Abs(-5);

      https://msdn.microsoft.com/en-us/lib...v=vs.110).aspx
      Guessing is no good. The statistical median has nothing to do with the bar median. In this case Ehlers has the input series smoothed with a triangular moving average, then calculates the statistical median from the last 39 values of the triangular moving average.

      NinjaTrader comes with a pre-built function to calculate the median. This function is called GetMedian(). It is a bit squeer, as you have to deduct 1 before entering the argument. This is a bug, but has not been changed for NinjaTrader 8 to ensure compatibility with scripts created for NinjaTrader 7.

      To obtain a statistical median from the last 39 values of the triangular average "smooth", you need to call GetMedian(smooth, length - 1), where length has the default value of 39. I have built my own median functions which I use in various indicators.

      If you need the Median-Average Adaptive Filter coded for NT8, please let me know.

      Comment


        #4
        Originally posted by Harry View Post
        Guessing is no good. The statistical median has nothing to do with the bar median. In this case Ehlers has the input series smoothed with a triangular moving average, then calculates the statistical median from the last 39 values of the triangular moving average.

        NinjaTrader comes with a pre-built function to calculate the median. This function is called GetMedian(). It is a bit squeer, as you have to deduct 1 before entering the argument. This is a bug, but has not been changed for NinjaTrader 8 to ensure compatibility with scripts created for NinjaTrader 7.

        To obtain a statistical median from the last 39 values of the triangular average "smooth", you need to call GetMedian(smooth, length - 1), where length has the default value of 39. I have built my own median functions which I use in various indicators.

        If you need the Median-Average Adaptive Filter coded for NT8, please let me know.
        i shall be highly obliged if u share the same in this thread.

        Comment


          #5
          Median-Average Adaptive Filter

          I do not like this indicator, because it cannot be used with intraday data. Let me try to explain the details.

          The indicator uses the bar median (midpoint of the price bar) as an input series and smoothes it with a fast triangular moving average TMA(2). This is just done to get a smoother input signal.

          In a second step it compares an adaptive EMA(39) to a statistical Median(39). In case that the two series diverge by more than 0.2% the algorithm reduces the length from 39 to 37. This process is repeated until the difference between the two values is less than 0.2% of the value of the median. This means that the adaptive Average is forced into a channel around a median with a channel width of 0.4% of the median value.

          The whole exercise of comparing median and adaptive EMA is only used to determine the alpha value, which is used to calculate the MAA filter from the input signal.

          There is a number of problems that arise from this approach:

          First of all, the value of 0.2% is completely arbitrary. Taking a percentage of the absolute value of the median does not make sense. This value should be somehow bound to volatility. A multiple of the average range, the average true range or the standard deviation would be more suitable for the purpose of calculating an adaptive moving average.

          As a consequence the value of 0.2% only works with daily charts. This is what it was designed for. Therefore the indicator cannot be used with intraday charts. Moreover the indicator cannot be applied to an input series other than price. This would be possible, if the standard deviation or the average true range of the input series was used rather than a fixed value of 0.2%.
          median channel.

          In my opinion there are several things that need to be done, before the indicator can be used as intended:

          -> replace the fixed threshold with a variable threshold calculated from the average true range or the standard deviation of the input series
          -> include the case where the median becomes zero, which would allow to use the indicator with an input series other than price (nested indicators)

          The charts below show the MAAF applied to a daily and to a 5-min chart. As can be easily noticed, it does not work on the 5-min chart. I have then modified the MAAF and replaced the 0.2% threshold with the standard deviation of the input period divided by a factor. The modified indicator adapts to the median channel as intended.

          The project is not finished.
          Attached Files
          Last edited by Harry; 02-05-2017, 04:43 AM.

          Comment


            #6
            MAA Filter versus Adaptive Laguerre Filter

            There are lots of other filters available that can be used.

            For what reason did you select the Median-Average Adaptive Filter?

            Below is a comparison between the modified Median-Average Adaptive Filter (blue) and an Adaptive Laguerre Filter (red).
            Attached Files

            Comment


              #7
              I think I have found a solution for the MAAF. On a daily chart I am getting near-identical results to the original MAAF developed by John Ehlers when I use a threshold derived from historical volatility. The only problem here is that a training period of 252 days (number of working days in a year) is needed to determine the correct value for the volatility.

              The NinjaTrader default indicator for determining the standard deviation is too slow to work with large periods. Therefore I have used a different approach for calculating volatility. The indicator now works both on daily data and on intraday data.

              Further testing is needed.

              But you will get your indicator.
              Attached Files
              Last edited by Harry; 02-05-2017, 07:32 AM.

              Comment


                #8
                Originally posted by Harry View Post
                I think I have found a solution for the MAAF. On a daily chart I am getting near-identical results to the original MAAF developed by John Ehlers when I use a threshold derived from historical volatility. The only problem here is that a training period of 252 days (number of working days in a year) is needed to determine the correct value for the volatility.

                The NinjaTrader default indicator for determining the standard deviation is too slow to work with large periods. Therefore I have used a different approach for calculating volatility. The indicator now works both on daily data and on intraday data.

                Further testing is needed.

                But you will get your indicator.
                do we have the luck of getting ur modified version as workable for nse/bse also?

                Comment


                  #9
                  Originally posted by sumana.m View Post
                  do we have the luck of getting ur modified version as workable for nse/bse also?
                  The indicator can be used with any instrument including all those traded on NSE/BSE. For the adaptive period best use the default period suggested by John Ehlers. For the volatility period

                  -> best select number of working days in a year for a daily chart
                  -> select any logical period for an intraday chart

                  example:

                  if you apply the indicator to a 15 min chart to ES 03-17, then you may either want to calculate your threshold from

                  -> a rolling day (last 24 hours of your chart)
                  -> or a rolling week (last 5 working days on your chart)

                  For a rolling day (ES 03-17), you would need 92 bars, for a rolling week (ES 03-17) you would need 460 bars. Therefore I would recommend to set the standard deviation period either to 92 or to 460. For NSE/BSE the correct settings would depend on the number of 15-min bars per trading day. I do not know the opening hours of those exchanges, but I am confident that you will the appropriate lookback period to cover the last 24 hours.
                  Last edited by Harry; 02-06-2017, 02:50 PM.

                  Comment


                    #10
                    Originally posted by Harry View Post
                    The indicator can be used with any instrument includign all those traded on NSE/BSE. For the adaptive period best use the default period suggested by John Ehlers. For the volatility period

                    -> best select number of working days in a year for a daily chart
                    -> select any logical period for an intraday chart

                    example:

                    if you apply the indicator to a 15 min chart to ES 03-17, then you may either want to calculate your threshold from

                    -> a rolling day (last 24 hours of your chart)
                    -> or a rolling week (last 5 working days on your chart)

                    For a rolling day (ES 03-17), you would need 92 bars, for a rolling week (ES 03-17) you would need 460 bars. Therefore I would recommend to set the standard deviation period either to 92 or to 460. For NSE/BSE the correct settings would depend on the number of 15-min bars per trading day. I do not know the opening hours of those exchanges, but I am confident that you will the appropriate lookback period to cover the last 24 hours.
                    hi

                    please share both of them ...

                    Comment


                      #11
                      Sorry for the delay. I have been held back by other occupations. Will come back and share the indicator.
                      Last edited by Harry; 03-09-2017, 09:37 AM.

                      Comment


                        #12
                        The indicator is now available here:

                        The Median-Average Adaptive Filter was introduced by John F. Ehlers in the Stocks & Commodities article "The Secret Behind The Filter - What&#8217;s The Difference". It addresses the difference between two types of noise filters, namely the average and the median.

                        Comment

                        Latest Posts

                        Collapse

                        Topics Statistics Last Post
                        Started by algospoke, Today, 06:40 PM
                        0 responses
                        10 views
                        0 likes
                        Last Post algospoke  
                        Started by maybeimnotrader, Today, 05:46 PM
                        0 responses
                        7 views
                        0 likes
                        Last Post maybeimnotrader  
                        Started by quantismo, Today, 05:13 PM
                        0 responses
                        7 views
                        0 likes
                        Last Post quantismo  
                        Started by AttiM, 02-14-2024, 05:20 PM
                        8 responses
                        168 views
                        0 likes
                        Last Post jeronymite  
                        Started by cre8able, Today, 04:22 PM
                        0 responses
                        10 views
                        0 likes
                        Last Post cre8able  
                        Working...
                        X