If this is your first visit, you will have to register before you can post. To view messages, please scroll below and select the forum that you would like to visits. Questions? Be sure to check out the Forum FAQ.
Announcement
Collapse
Looking for a User App or Add-On built by the NinjaTrader community?
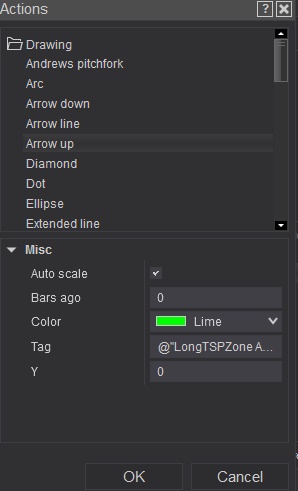
I have a statement and have created action to draw up arrow but its not working OR i do not see the drawing (which could be no at the proper axis or something
In your example screenshot the Y value (or price level) is at 0, so your arrow would be at the price level of 0, this is the default behavior of the strategy builder when you do not provide where you want to place the arrow vertically on the chart. The 0 for "bars ago is the "when" in time the arrow is placed and 0 would be the bar that is being processed when your conditions to draw the arrow are true.
Also, when draw objects use the same tag name, you will only see the latest arrow and this is the default behavior in the strategy builder to minimize the draw objects. If you would like to see all the historical occurrences of the arrow, you would need to make your draw object tag name unique per instance of drawing the object.
what i was trying to do was to plot a drawing in the price area or just below. So what would be an approapiate Y setting as prices vary etc
Also i was wanting to draw where the Slope was > 0.12 of a MA as to research an appropreite setting for use in a strat
In the video I provided I showed using either High or Low price. These are typically used because when you scroll your chart left or right and the price scale is on autoscale the arrows will usually be visible. You can also use any indicator that provides a plot.
Regarding slope, I've attached an example where if the slope of a 20 period SMA is > 0.12, for each bar where that is true, to draw a blue dot on the 20 period moving average.
if the attachment is the image show in the post, i see it but i CANNOT read the input window is too small. I do not see an attachment or link to open a image file to view larger

Comment