I have a statement and have created action to draw up arrow but its not working OR i do not see the drawing (which could be no at the proper axis or something
Thanks for any help
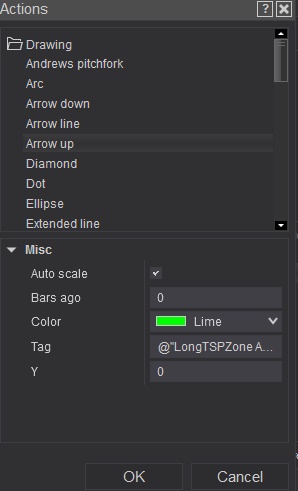
Thanks for any help

| Topics | Statistics | Last Post | ||
|---|---|---|---|---|
|
0 responses
1 view
0 likes
|
by FrancisMorro
Today, 03:24 AM
|
|||
|
10 responses
1,769 views
0 likes
|
by Leafcutter
Today, 03:01 AM
|
|||
|
2 responses
30 views
0 likes
|
by Max238
Today, 02:25 AM
|
|||
|
24 responses
943 views
0 likes
|
by spwizard
Today, 01:29 AM
|
|||
|
0 responses
10 views
0 likes
|
by Max238
Today, 01:28 AM
|
Comment