
Hi Everyone,
I am looking for a way to create a strategy based on a D stochastic divergence on the 1 min chart. For instance, in the previous 20 periods, the D stochastic dropped below 20, created a low in the indicator, but the price continued to drop, then the indicator created a higher low (and the low was above 20 on the stochastic indicator). So a lookback period of 20 is needed, but i have no clue how to finish the strategy, i've tried all kinds of things. Any help would be appreciated. I have attached a picture to describe what I am talking about.
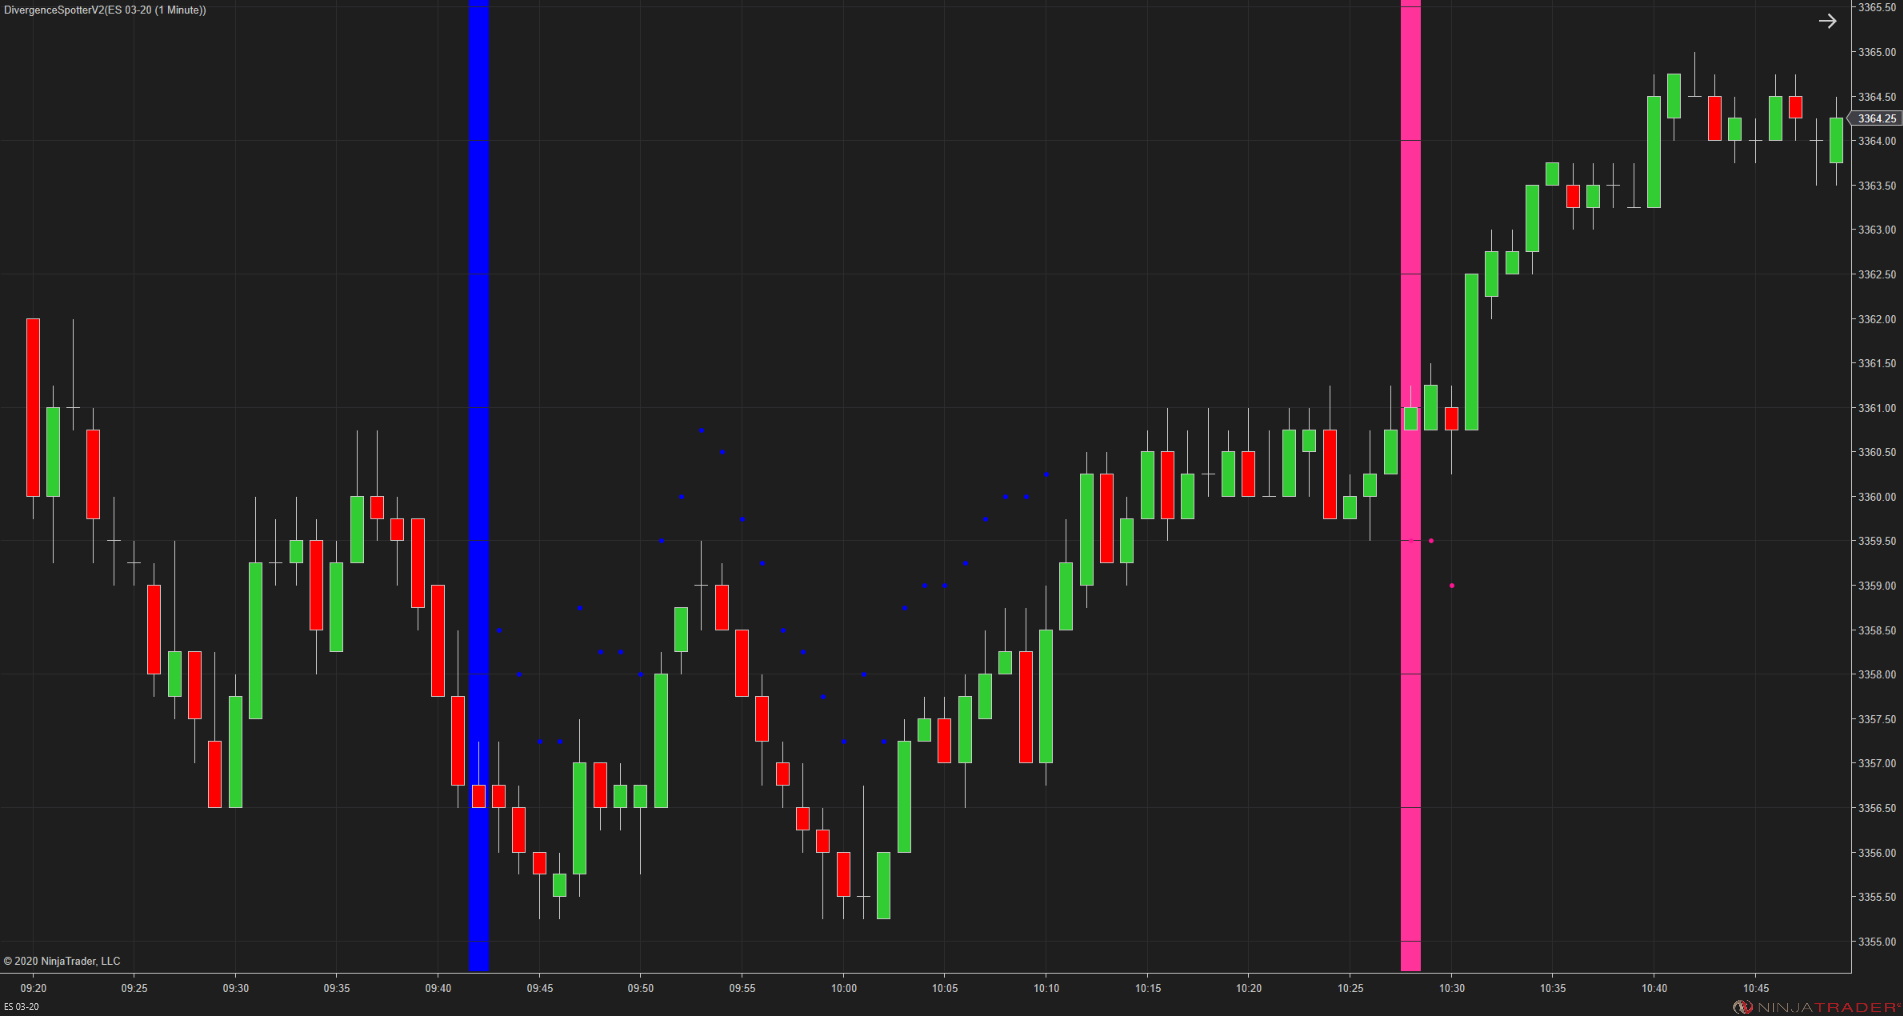
In the pic, you can see that in the highlighted area that the D stochastic dropped below 20, but price continued to make lower lows, then the stochastic made a higher low on the next rotation down and price took off to the upside. I would like to find a way to create a strategy out of this with a lookback period of 20 periods.
Appreciate any help,
thanks,
Ian
I am looking for a way to create a strategy based on a D stochastic divergence on the 1 min chart. For instance, in the previous 20 periods, the D stochastic dropped below 20, created a low in the indicator, but the price continued to drop, then the indicator created a higher low (and the low was above 20 on the stochastic indicator). So a lookback period of 20 is needed, but i have no clue how to finish the strategy, i've tried all kinds of things. Any help would be appreciated. I have attached a picture to describe what I am talking about.
In the pic, you can see that in the highlighted area that the D stochastic dropped below 20, but price continued to make lower lows, then the stochastic made a higher low on the next rotation down and price took off to the upside. I would like to find a way to create a strategy out of this with a lookback period of 20 periods.
Appreciate any help,
thanks,
Ian
Attached Files
Comment