
Hello,
I would like to make 2 suggestions about plot executions on charts.
1) add an option to link (or not) the plot executions to the ATM strategy selected on ChartTrader. So that it only shows plot executions for the ATM strategies that really have been used to trade and show no executions on the chart for ATM strategies which were not used to trade.
2) On top of the number of contracts and price of entry or exit displayed by plot executions, allow an option to also show with those plots the name of the strategy which was launched for this specific trade.
Exemple : show something like this instead
"Marc >>> 2"
Target 1
2 @ 3362
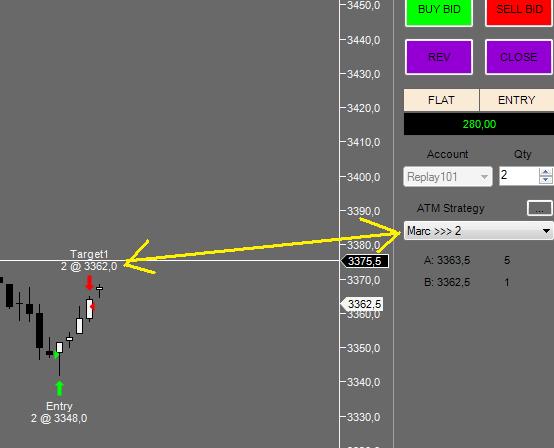
That way, we can trace back more clearly trade events on the chart and classify them visually by strategies used, just after a quick glance.
I would like to make 2 suggestions about plot executions on charts.
1) add an option to link (or not) the plot executions to the ATM strategy selected on ChartTrader. So that it only shows plot executions for the ATM strategies that really have been used to trade and show no executions on the chart for ATM strategies which were not used to trade.
2) On top of the number of contracts and price of entry or exit displayed by plot executions, allow an option to also show with those plots the name of the strategy which was launched for this specific trade.
Exemple : show something like this instead
"Marc >>> 2"
Target 1
2 @ 3362
That way, we can trace back more clearly trade events on the chart and classify them visually by strategies used, just after a quick glance.
Comment