
Hello Holiday,
Thank you for your post, I have added your vote for this feature as well.
Please let me know if I may assist further.
-
Hello,
Is there an update on the ability to chart in % change? If not, please add my vote for this feature.Leave a comment:
-
Thanks Cory,Originally posted by nkhoi View Post
That obviously seemed like a plug. I will take a look at show me the money and perhaps try to convert it. I think Sim22 did something similar, but not really useful.
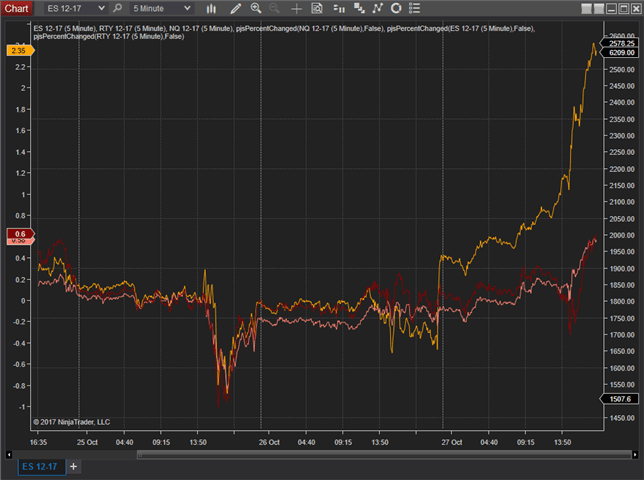
I am looking for for something to compare % change for several instruments starting from 0 at the RTH.
Cheers!Leave a comment:
-
Thank you Bruce. I can not use free compressed files. Could you please post here a free open source version of this indicator to benefit all?
Cheers!Leave a comment:
-
Alligator, there is a free "NS_Leaders_Laggers" indicator that displays % change for up to 16 instruments at https://neurostreet.com/shop/free-indicators/
You will be asked for your email address, which will grant you access to download eight free indicators.
This is the description of the Leaders_Laggers indicator:
"This indicator is used to identify market correlation based on % change. We use this to identify strength and weakness between correlated and non-correlated assets. This can be useful when looking at market selection."
Tips for settings:
Inst1-15 should be replaced with specific expiration months, such as CL 01-19, rather than CL ##-##.
The instrument of your main chart will be assigned the Plot1 color.
Inst1 will be assigned the color set for Plot2, and so on...Last edited by BruceK; 11-24-2018, 02:53 PM.Leave a comment:
-
Thank DaFish,Originally posted by DaFish View Post
This is a good indicator, very close, but not quite at least for what I had in mind.
I want to simply compare the intraday performance of several instruments since the session open by comparing their percent change since the current session open. A few minor changes will make your indicator perfect:
1. Use the current session Open price instead of yesterday's close to calculate % change.
2. Instead of draw text, simply plot the %Change for the current day.
3. More than one security to be plotted for comparison
4. I would use 1-day of data (1m or 5m)
The idea is to see the leaders and the lagers for day trading short time frames. We can of course do the same using the Market Analyzer, but an indicator is a better visual representation.
Many thanks.Leave a comment:
-
Thank you for your interest in the question. Well, we want the "dynamic percent change" )))Originally posted by DaFish View Post
For instance, you look at the weekly SP500 chart and would like to know how much it has changed from the 2008's crisis bottom? By the way, the change should be shown to both sides of the specified date (to the left and to the right). Then you can add the WTI or some stocks and look at their comparative percent changes...
This may be done in two ways:
1) you put the start date (start bar, zero change bar or how you can call it ) manually in the settings of the requested indicator;
2) vertical line appears after you put the requested indicator on the chart and you can drag and drop the line manually )))
So simple
Leave a comment:
-
Day net change
Hi. are you talking about an indicator to just display the net change in a day? I have posted mine here for you. It looks at yesterday close, then just calculates the net change in both, amount and percentage and displays it in Red or green. It also allows you to display it any of the 4 corners you want....
Is this what your talking about ? if so, here it is...Leave a comment:
-
guidoisot, Hi.Originally posted by guidoisot View Post
Well, a .dll package can include any type of programs, both good and bad that will reside on your computer without your knowledge of any malicious intents.
A .dll code is basically locked and one cannot easily edit, copy, or check the contents without specialized tools. Most reputable vendors will ship a .dll package to keep their proprietary contents from being pirated, modified, etc.
Therefore Installing a .dll package can be a security risk unless it is obtained or purchased from a well-known vendor, or vendors with some sort of certification from a sponsor like NinjaTrader.
That is not to say that all .dll packages are risky. However, it begs the question about the motive of someone (however genuine) that is willing to share in public a program for free that you have no way of knowing the contents of that program.
The practice of posting free programs in open source code is customary and mainly to allow improvement, innovation, and sharing of ideas to advance a project.
For me, a free zipped .dll package is a red flag before installing. Although, in the past after unzipping and finding a .dll file, I have contacted authors and they graciously re-posted an open source version for that code.
By the way, NinjaTrader rules prohibits posting .dll files, perhaps for liability reasons, but not everyone read the rules.
Cheers!Last edited by aligator; 03-08-2018, 07:48 PM.Leave a comment:
-
Thanks for telling me. I did not notice it was a dll. What are, generally speaking, without referring to this specific indicator, the risk associated to installing any dll.. Thank you.Leave a comment:
-
I did not download and test yet....looks like it performs well... but also looks like a lot of button pressing...any effort in this area is to be commended.Leave a comment:
-
maybe this:Originally posted by aligator View Post
is something close to what is being discussed hereLeave a comment:
| Topics | Statistics | Last Post | ||
|---|---|---|---|---|
|
0 responses
17 views
0 likes
|
by knowmad
Today, 03:52 AM
|
|||
|
0 responses
12 views
0 likes
|
|
|||
|
4 responses
63 views
0 likes
|
by effraenk
Today, 02:15 AM
|
|||
|
5 responses
2,213 views
0 likes
|
by leodavis
Today, 02:11 AM
|
|||
|
2 responses
14 views
0 likes
|
by kujista
Today, 02:02 AM
|
Leave a comment: