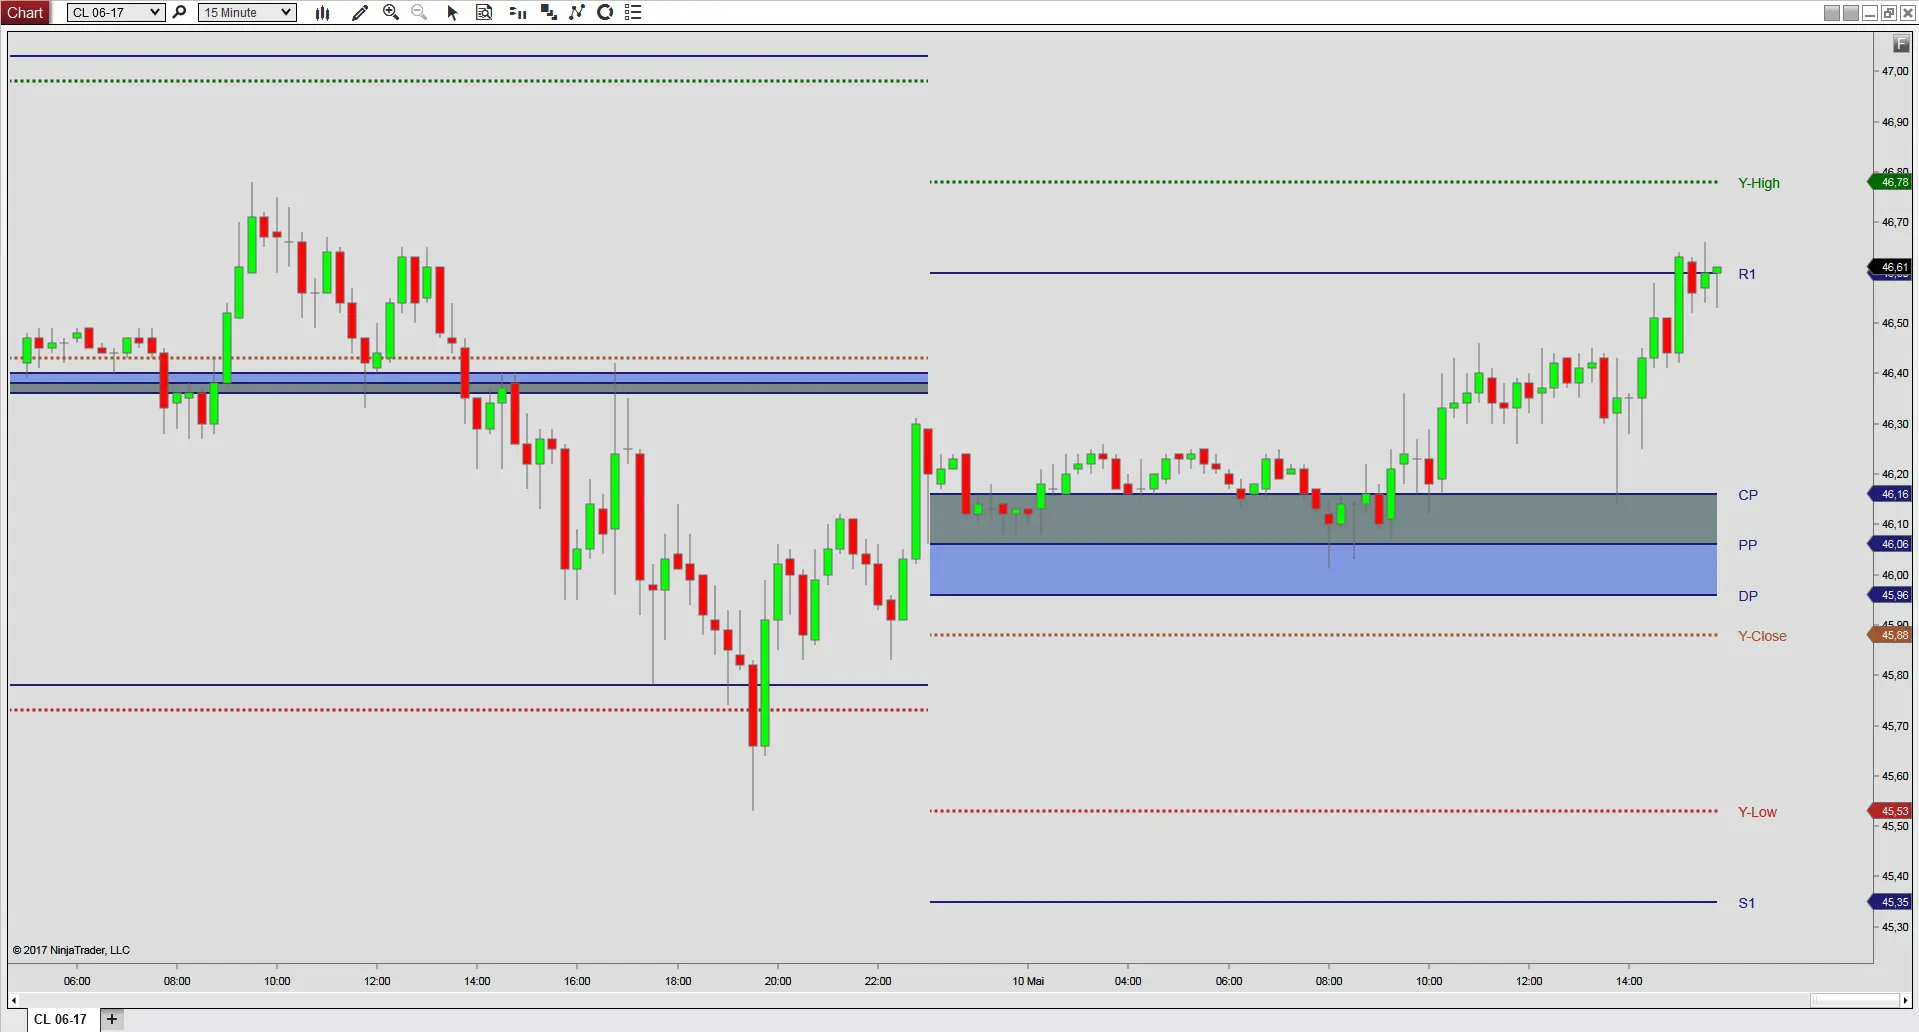
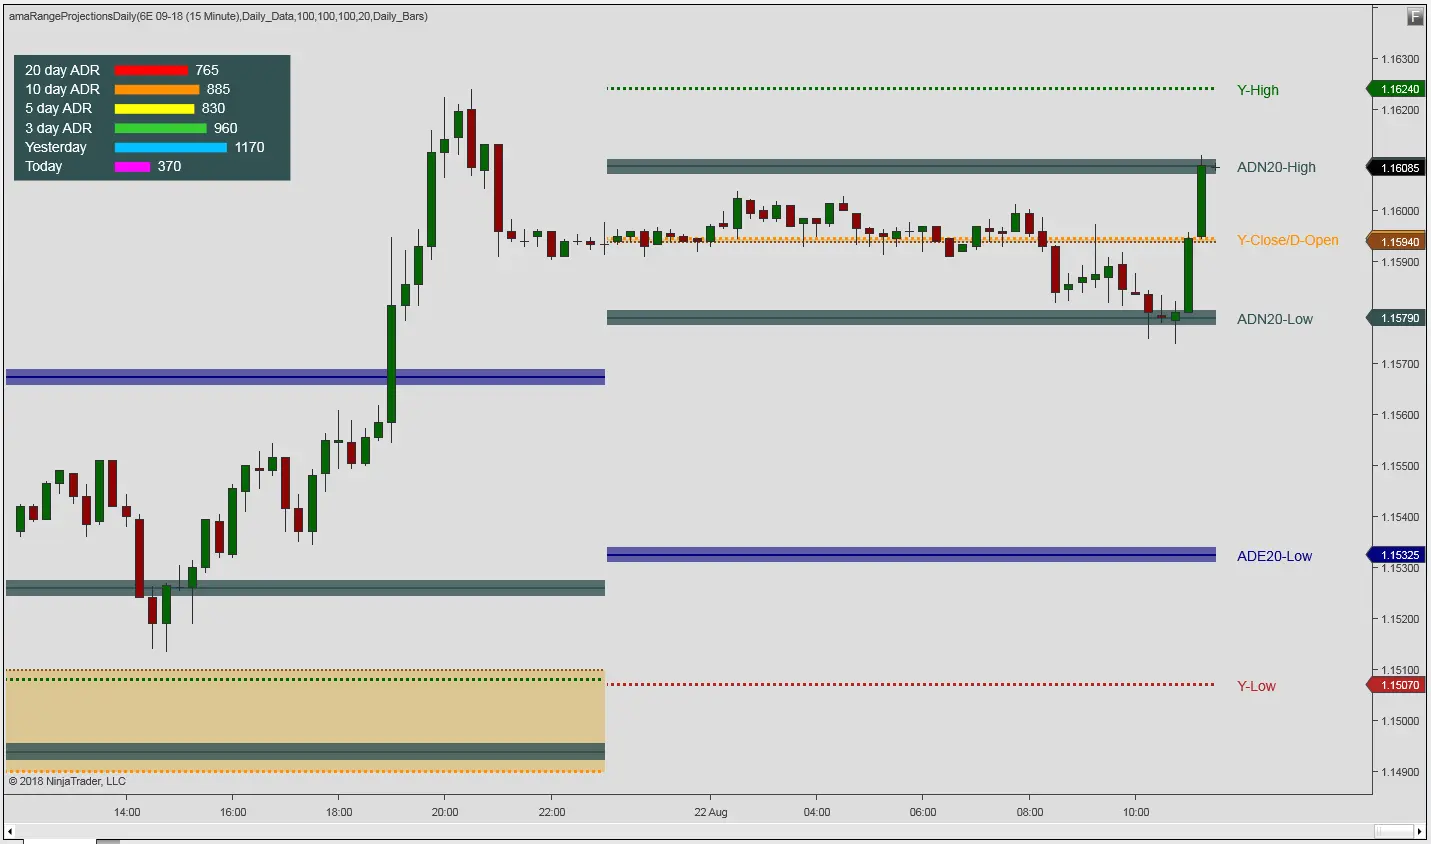
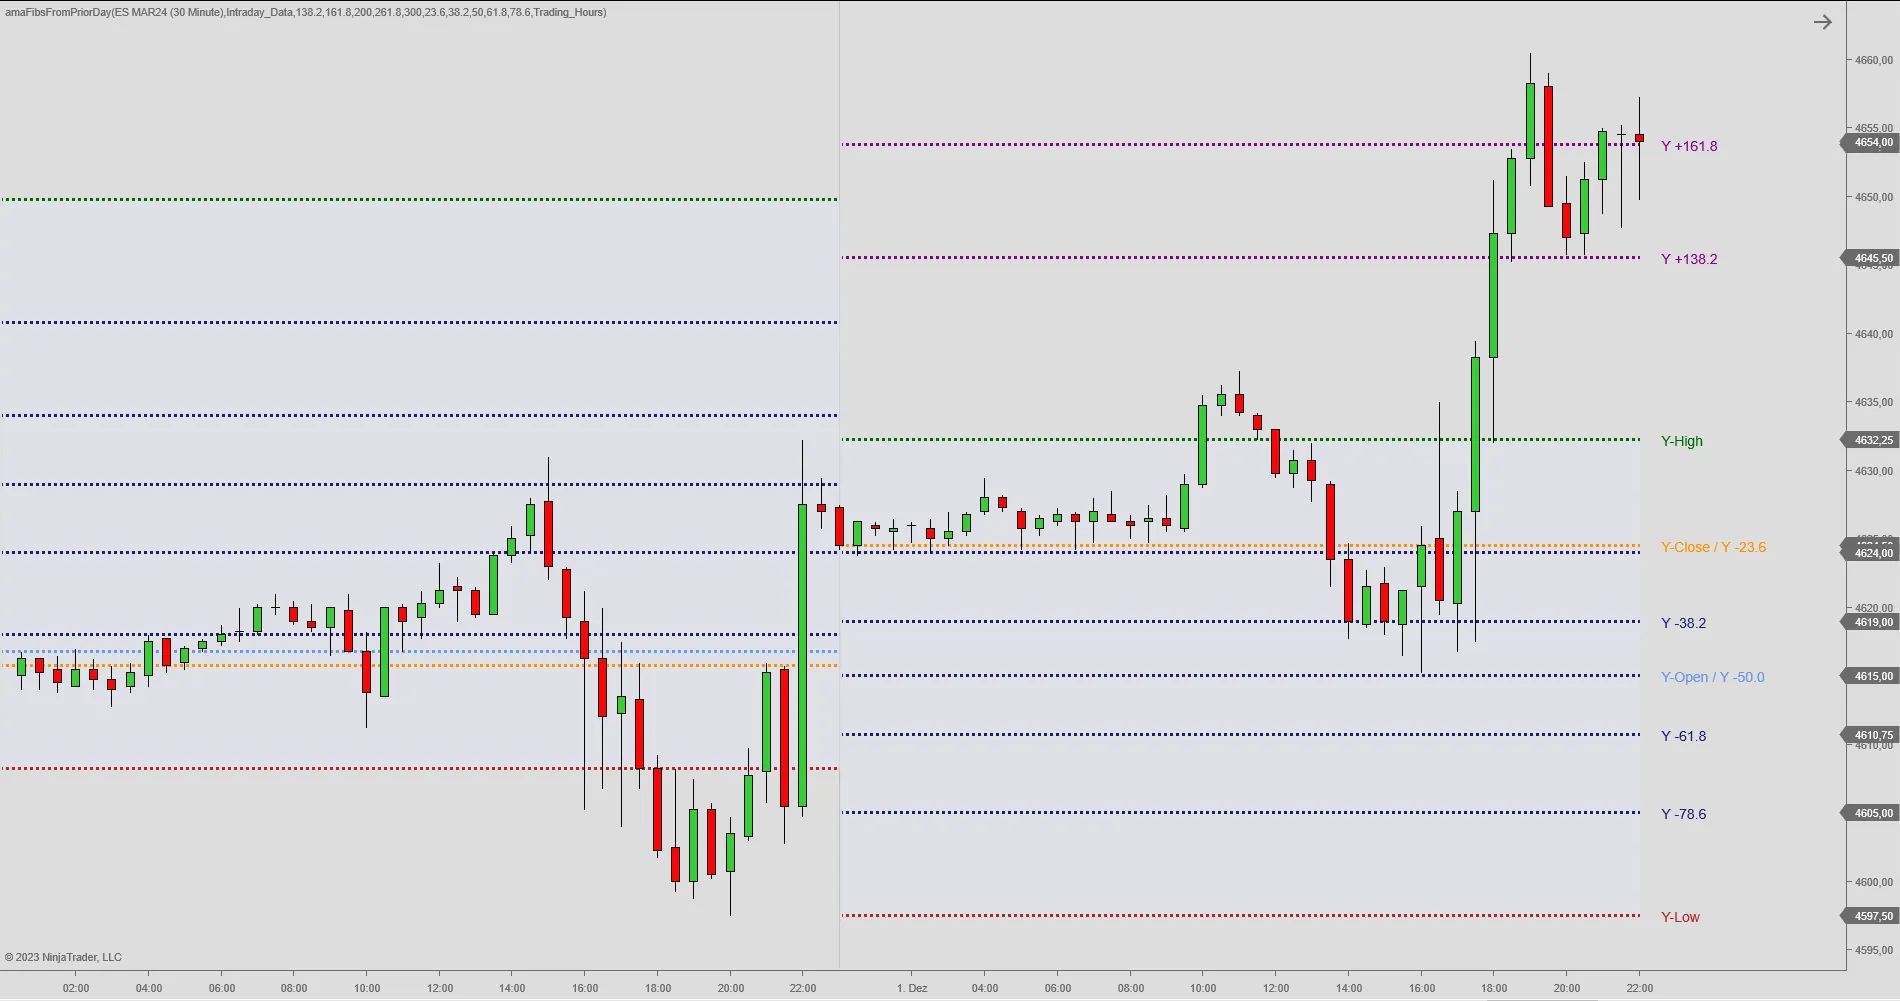
Thanks,


if(IsConnected())
{
   if(tradingDate0[0] > tradingDate1[0])
       priorClose = currentDailyClose;
  else
       priorClose = priorDailyClose;
}
else // workaround
{
  priorClose = currentHistoricalClose[1];
  count = 0;
  priorDailyBarDate = BarsArray[1].GetTime(BarsArray[1].GetBar(Times[0][1]));
  dailyBarDate = BarsArray[1].GetTime(BarsArray[1].GetBar(Times[0][0]));
  if(priorDailyBarDate == dailyBarDate && BarsArray[1].Count - 2 > CurrentBars[1])
  {
       while (priorDailyBarDate >= dailyBarDate)
       {
             count = count - 1;
             priorDailyBarDate = BarsArray[1].GetTime(BarsArray[1].GetBar(Times[0][1].AddDays(count)));
             if (count == -5)
                  break;
       }
       priorClose = BarsArray[1].GetClose(BarsArray[1].GetBar(Times[0][1].AddDays(count)));
   }
 }
| Topics | Statistics | Last Post | ||
|---|---|---|---|---|
|
Started by rdtdale, Today, 01:02 PM
|
0 responses
1 view
0 likes
|
Last Post
by rdtdale
Today, 01:02 PM
|
||
|
Started by alifarahani, Today, 09:40 AM
|
3 responses
15 views
0 likes
|
Last Post
|
||
|
Started by RookieTrader, Today, 09:37 AM
|
4 responses
18 views
0 likes
|
Last Post
by RookieTrader
Today, 12:46 PM
|
||
|
Started by PaulMohn, Today, 12:36 PM
|
0 responses
6 views
0 likes
|
Last Post
by PaulMohn
Today, 12:36 PM
|
||
|
Started by love2code2trade, 04-17-2024, 01:45 PM
|
4 responses
40 views
0 likes
|
Last Post
|
Futures, foreign currency and options trading contains substantial risk and is not for every investor. An investor could potentially lose all or more than the initial investment. Risk capital is money that can be lost without jeopardizing one’s financial security or lifestyle. Only risk capital should be used for trading and only those with sufficient risk capital should consider trading. Past performance is not necessarily indicative of future results. View Full Risk Disclosure.
CFTC Rules 4.41 - Hypothetical or Simulated performance results have certain limitations, unlike an actual performance record, simulated results do not represent actual trading. Also, since the trades have not been executed, the results may have under-or-over compensated for the impact, if any, of certain market factors, such as lack of liquidity. Simulated trading programs in general are also subject to the fact that they are designed with the benefit of hindsight. No representation is being made that any account will or is likely to achieve profit or losses similar to those shown.
This website is hosted and operated by NinjaTrader, LLC (“NT”), a software development company which owns and supports all proprietary technology relating to and including the NinjaTrader trading platform. NT is an affiliated company to NinjaTrader Brokerage (“NTB”), which is a NFA registered introducing broker (NFA #0339976) providing brokerage services to traders of futures and foreign exchange products. This website is intended for educational and informational purposes only and should not be viewed as a solicitation or recommendation of any product, service or trading strategy. No offer or solicitation to buy or sell securities, securities derivative or futures products of any kind, or any type of trading or investment advice, recommendation or strategy, is made, given, or in any manner endorsed by any NT affiliate and the information made available on this Web site is not an offer or solicitation of any kind. Specific questions related to a brokerage account should be sent to your broker directly. The content and opinions expressed on this website are those of the authors and do not necessarily reflect the official policy or position of NT or any of its affiliates.
Vendors along with their websites, products and services, collectively referred to as (“Vendor Content”), are independent persons or companies that are in no manner affiliated with NT or any if its affiliates. NT or any of its affiliates are not responsible for, do not approve, recommend or endorse any Vendor Content referenced on this website and it’s your sole responsibility to evaluate Vendor Content. Please be aware that any performance information provided by a vendor should be considered hypothetical and must contain the disclosures required by NFA Rule 2-29(c). If you are interested in learning more about, or investigating the quality of, any such Vendor Content you must contact the vendor, provider or seller of such Vendor Content. No person employed by, or associated with, NT or any of its affiliates is authorized to provide any information about any such Vendor Content.

Comment