Start an Optimization
To run an Optimization:
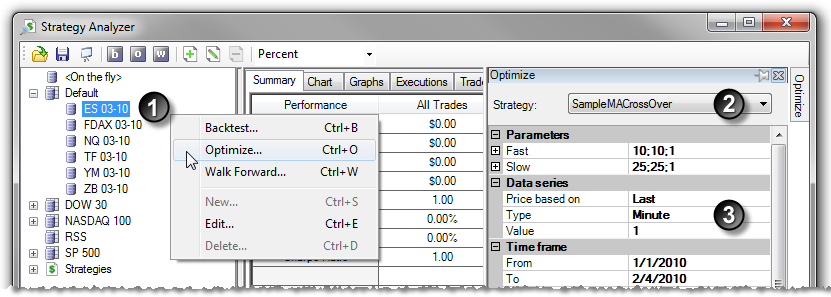
| 1. | Left mouse click on an instrument or instrument list (to run optimization on the entire list of instruments) and right mouse click to bring up the right mouse click menu. Select the menu item Alternatively left mouse click on the "o" icon in the Strategy Analyzer toolbar. The default Hot Key CTRL + O can also be used. |
| 2. | Select a strategy from the Strategy slide out menu |
| 3. | Set the backtest properties (See the "Understanding optimization properties" section below for property definitions) and press the OK button. |
The optimization progress will be shown in the Status Bar of the Control Center.
Setting the Test Range
The strategy input parameters can be expanded to display the following sub-parameters:
Min. value - The starting value you want to test
Max. value - The last value to test
Increment - The increment value (step value) used to increment the starting value by for each subsequent optimization pass
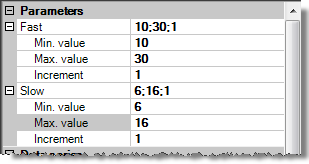
In the image above, the input "Fast" has a starting (initial) value of 10 and an ending value of 30 with an increment of 1. This means that the first value tested will be 10, then 11, then 12 all the way through 30. The input "Slow" has a starting value of 6, ending value of 16 with an increment of 1. Based on these settings, a total of 200 (20 unique values for "Fast" multiplied by 10 unique values for "Slow") backtest iterations will be processed in order to find the optimal combination of input values based on the best result criterion.
|
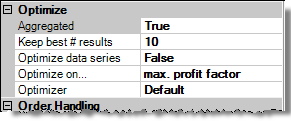
Setting the Best Result Criterion
Optimization is based on the best result criterion you select. If you set the property "Optimize on..." to "Max. net profit", the optimizer will seek the optimal input values that return the maximum profit possible. There are over 10 different optimization criterion you can select. Please see the "Understanding Optimization properties" section below for more information.
The Best Optimization Result
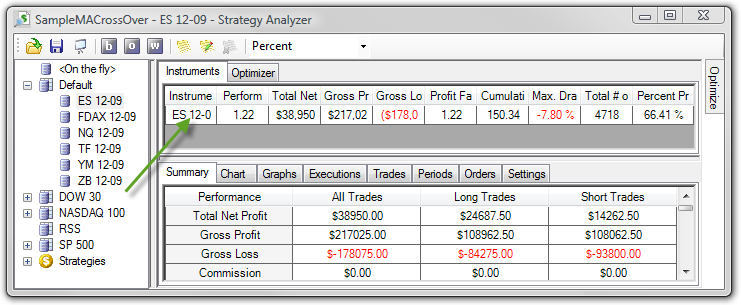
Once the optimization process is complete, you will see a "Instruments" tab and a "Optimizer" tab. The "Instruments" tab will display the best optimization result for each unique instrument that was selected for optimization. Selecting each result row will display the performance data for that instrument.
The Top Optimization Results
The Optimizer tab will display the top number of results based on the value you set for the "Keep best # results" property in the Optimizer dialog window. The column Parameters displays the optimized input values.
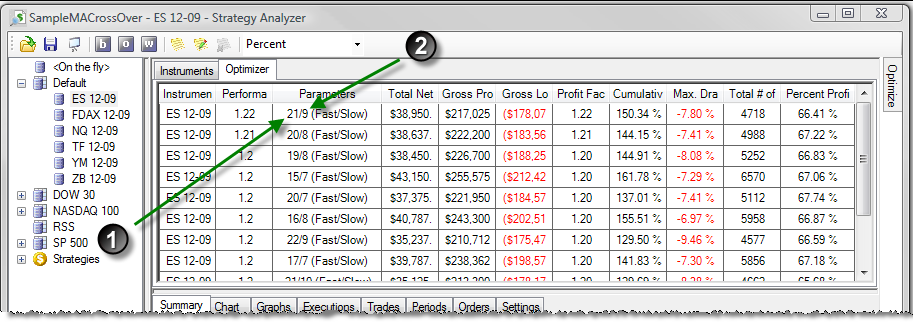
| 1. | The optimal value for the "Fast" input for the demonstration strategy used for this optimization |
| 2. | The optimal value for the "Slow" input for the demonstration strategy used for this optimization |
|