
In this week’s coverage, we analyze the recent uptrends in the Japanese yen, corn, and silver markets, and the consolidation in the E-mini Dow Jones Index futures chart. We also examine the economic reports and earnings announcements expected next week.
Commentary and charts reflect data at the time of writing. Market conditions are subject to change and may not reflect all market activity.
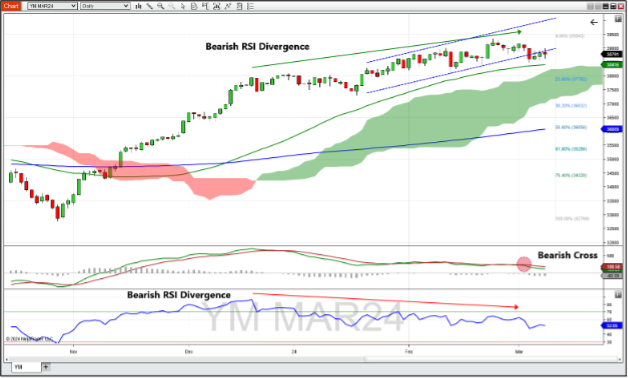
March E-Mini Dow Jones Index Futures Daily Chart
March E-mini Dow Jones Index futures finished down last week despite seeing a rally after Tuesday’s bearish action. That move on Tuesday pushed the Dow below the supporting end of the trend channel, which has acted as resistance ever since. While the Dow is trading above the Ichimoku cloud and its 50-Day and 200-Day moving averages, the peak highs in price are slowly trending downward, suggesting a topping formation is forming. The MACD saw a bearish cross of its signal line, and the RSI shows bearish divergence with peak highs decreasing since mid-December (while the Dow had increasing peak high since that same time, only recently seeing those peak highs taper off). Should this market break down, support might be found at the 50-day MA (38,416) and at the 23.6% Fibonacci retracement level off the uptrend that began in late October (~37,800). If the Dow rallies, resistance might be found at the top of the trend channel (~40,000).
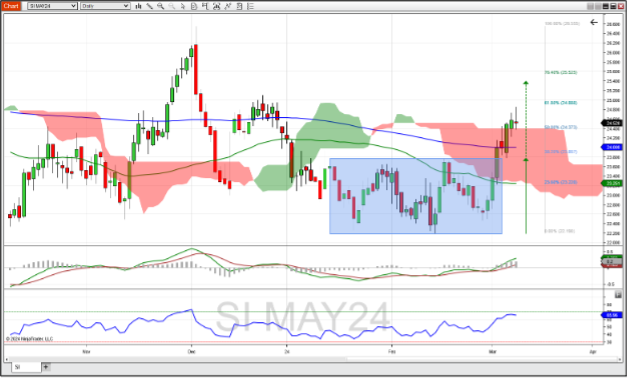
May Silver Futures Daily Chart
May silver futures made strong bullish progress last week by crossing above the 200-day moving average and the Ichimoku cloud, and breaking out of a consolidation zone that began in mid-January. The implied move of this breakout suggests a target of 25.40. The MACD turned positive and so did the MACD histogram, both of which are bullish. The RSI could not quite get to the overbought level of 70 though, indicating that a pause might be imminent. Should this trend continue, resistance might be found at the 61.8% Fibonacci retracement level (24.88). A reversal back into the cloud might find support at the 200-day moving average (~24.00) and further at the 38.2% Fib level (23.85).
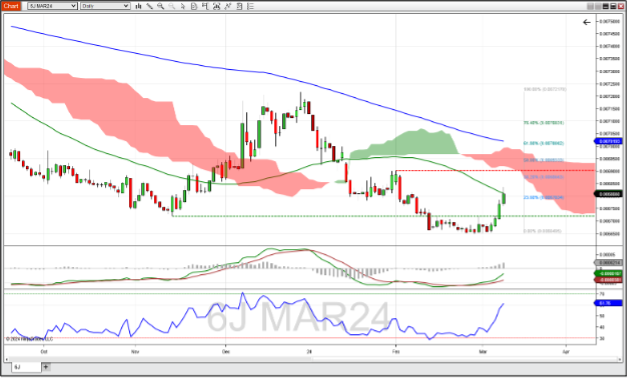
March Japanese Yen Futures Weekly Chart
March Japanese yen futures bounced of recent lows to start the week, breaking through a resistance level that was a previous low and support area at ~0.0067200. The yen closed just above the 23.6% Fibonacci retracement level of the downtrend that began at the beginning of the year, though was held down by the 50-day moving average. The MACD and its histogram are positive and bullish, and showing signs of increasing bullish momentum. RSI’s leap to the 60+ range also suggests that the yen is gaining in momentum. If the uptrend continues, look for resistance at the recent high of ~0.006900, which could be reinforced by the bottom of the Ichimoku cloud. Support might be found at the 23.6% Fib level (~0.0067800) and at the recent resistance level of 0.0067200.
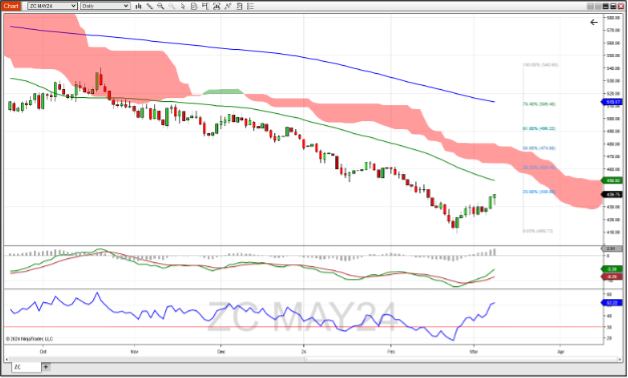
May Corn Futures Weekly Chart
May corn futures rallied on Friday with global corn production forecast to decrease in the current crop year. This extended the rally that began two weeks ago, finding resistance right at the 23.6% Fibonacci retracement level of the downtrend that started in mid-October. The MACD and its histogram remains bullish since mid-week last week–and show no signs of slowing down. The RSI is trading in sync with price. Should this rally continue, anticipate resistance at the 50-day moving average (~451) and further up at the bottom of the Ichimoku cloud (~464.75). Look for support at 430 if this market turns down.
Companies Reporting Earnings March 11 – March 15
As earnings season closes out, the retail sector is well represented this week. Reports from Kohl’s Corporation on Tuesday, Dollar Tree on Wednesday, and Dollar General on Thursday could give insight into the health of the economy. DICK’s Sporting Goods and ULTA Beauty also paint the picture on the retail side. Oracle and Adobe represent the tech sector, so the Nasdaq and S&P 500 futures could be affected by these reports. The third largest producer of civil aircraft, Embraer, reports Friday morning–it will be interesting to see if Boeing’s struggles have an impact of Embraer’s company outlook.
| Date | Companies Earnings |
|---|---|
| Monday, March 11 | Oracle Corp. (JWN): $1.38 EPS Estimate, $12.29B Revenue Estimate (AMC) |
| Tuesday, March 12 | Archer-Daniels-Midland Co. (ADM): $1.42 EPS Estimate, $23.65B Revenue Estimate (BMO) Kohl’s Corporation (KSS): $1.24 EPS Estimate, $5.71B Revenue Estimate (BMO) |
| Wednesday, March 13 | Dollar Tree, Inc. (DLTR): $2.67 EPS Estimate, $8.67B Revenue Estimate (BMO) |
| Thursday, March 14 | Dollar General Corporation (DG): $1.74 EPS Estimate, $9.78B Revenue Estimate (BMO) DICK’S Sporting Goods, Inc. (DKS): $3.34 EPS Estimate, $3.75B Revenue Estimate (BMO) Adobe Inc. (ADBE): $4.38 EPS Estimate, $4.74B Revenue Estimate (AMC) ULTA Beauty (ULTA): $7.48 EPS Estimate, $3.52B Revenue Estimate (AMC) |
| Friday, March 15 | Embraer (ERJ): $0.38 EPS Estimate, $2.21B Revenue Estimate (BMO) |
* indicates that this company is in the Dow Jones Index
Economic Reports for the week of March 11 – March 15
As FOMC members are silent ahead of the next announcement on March 20, Consumer Price Index (CPI) on Tuesday and Producers Price Index (PPI) on Thursday may do all the talking on the inflation side of the Fed’s dual mandate.
With headline CPI expected to remain constant at 3.1%, look for volatility in stock index futures, precious metals, and currency futures if there is variation in either direction. The same could be said for PPI, to a lesser extent. The New York Manufacturing Index on Friday could also move markets, as it is forecast to trend more negative (-7.6 vs. the previous month’s -2.4).
The amount of crude oil put into storage has been declining for the last month; Wednesday’s EIA report will let us know if we are pivoting to removing crude from storage, which could see a reduction in oil prices. The 30-year bond auction on Wednesday afternoon could also move markets as we discover if the appetite for U.S. long-term debt is waning.
| Date | Economic Reports |
|---|---|
| Monday, March 11 | Export Inspections |
| Tuesday, March 12 | 6:00 AM ET: NFIB Small Business Optimism Index 8:30 AM ET: CPI *** 2:00 PM ET: Treasury Statement 4:30 PM ET: API Weekly Oil Stocks |
| Wednesday, March 13 | 7:00 AM ET: MBA Mortgage Applications 10:00 AM ET: Quarterly Services Survey 10:30 AM ET: EIA Petroleum Status Report * 1:00 PM ET: 30-Year Bond Auction |
| Thursday, March 14 | 8:30 AM ET: Jobless Claims *** 8:30 AM ET: PPI-Final Demand * 8:30 AM ET: Retail Sales * 8:30 AM ET: Export Sales 10:00 AM ET: Business Inventories 10:30 AM ET: EIA Natural Gas Report 4:30 PM ET: Fed Balance Sheet |
| Friday, March 15 | 8:30 AM ET: Import and Export Prices 8:30 AM ET: Empire State Manufacturing Index * 9:15 AM ET: Industrial Production 10:00 AM ET: Consumer Sentiment 1:00 PM ET: Baker Hughes Rig Count |
*** Market Moving Indicators
* Merit Extra Attention
Daily Futures Market Prep and Analysis With the Pros
Interact with our experts and other futures traders during daily livestreams as we analyze the markets in real time and explore our award-winning desktop platform. Log in here.
Trade Futures With Us
Sign up for your free NinjaTrader account today to start your 14-day trial of live simulated futures trading.
