One of the most important concepts for a futures trader to understand is the trend of the market. If you’re asking yourself, “How strong is the trend? Will it change soon? Is the trend reversal solid, or will it resume the previous trend direction?” then the MACD indicator may be your answer.
How can the MACD indicator help me?
Momentum indicators can help you understand and identify trend concepts in a trading chart. One popular momentum indicator used by traders is the Moving Average Convergence Divergence (MACD) indicator.
Learn How to Use the MACD Indicator for Futures Trading
What is the MACD indicator?
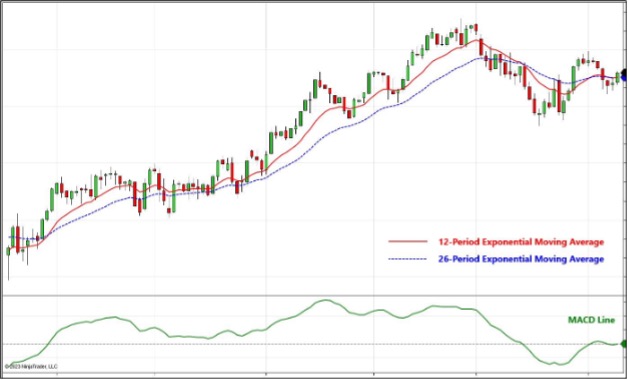
Developed by Gerald Appel in the late 1970s, the premise of the MACD indicator builds off the idea of using two different moving averages to identify trend change. It’s thought that when a faster moving average crosses above a slower moving average, a bullish price trend is indicated; when a faster moving average crosses below a slower moving average, a bearish trend is indicated. The MACD takes that concept and simplifies it into one line by taking the difference of the two moving averages.
The most common calculation for creating the MACD indicator is found by taking the difference of the shorter-term and the longer-term moving average. Appel determined that subtracting the 26-period from the 12-period exponential moving average worked best, which is why these are default settings for the MACD study on most platforms. You can edit the moving average lengths to better suit your type of trading or analysis. (Figure 1)
How to Read MACD Indicator Charts
Determining the Trend
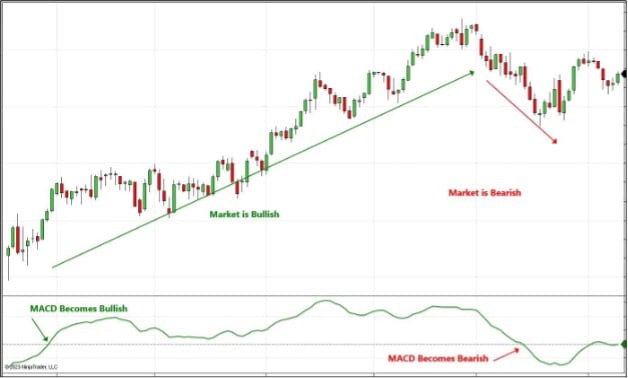
The MACD simplifies the analysis of moving averages and trends by boiling the moving averages down to one value (MACD), which allows us to make an easy judgment: is the MACD above or below zero? Because the MACD is simply a difference of two moving averages, the value can be positive or negative.
- If the MACD is positive, the trend will most likely be bullish.
- If the MACD is negative, the trend will most likely be bearish.
Generally, the MACD crossing the zero line is more of a confirmation signal of the trend rather than an actionable trading signal, as a cross often appears some time after a new trend begins. (Figure 2)
Identifying Trend Change Using the Signal Line
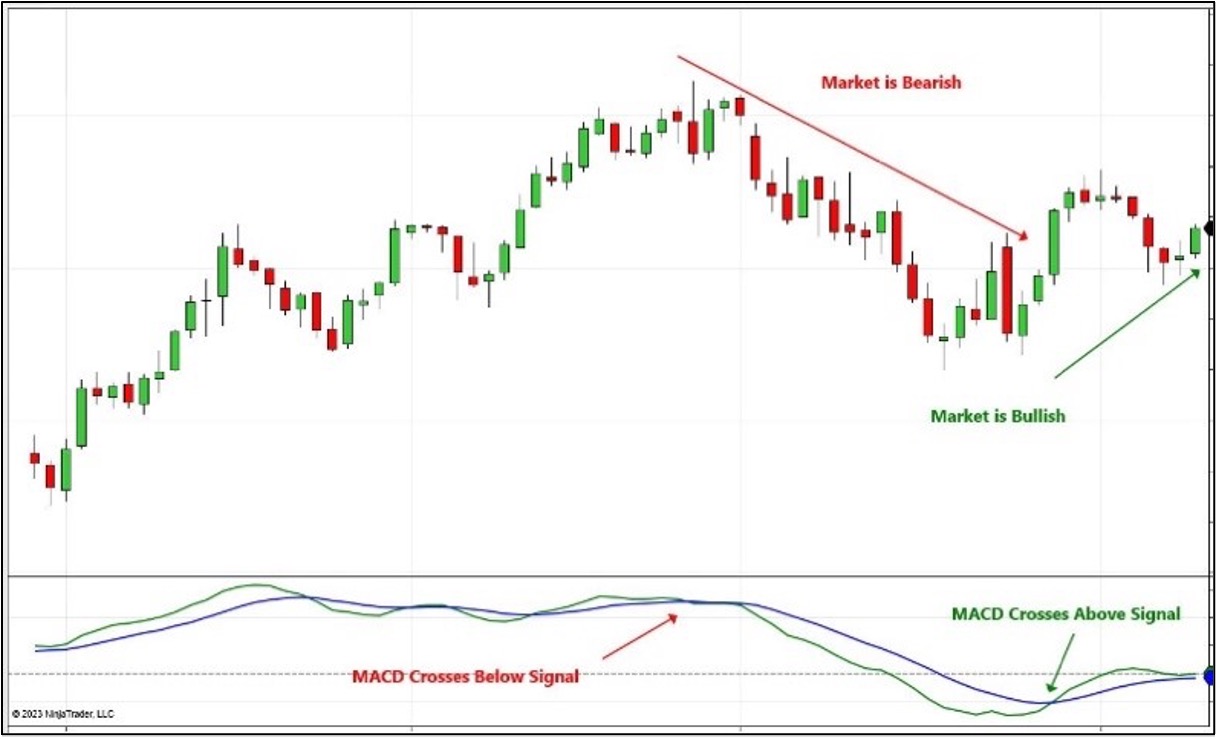
The work that Appel did with MACD did not stop there. Using the concept of smoothing a line to act as a signal generator, he created the signal line, which defaults to a 9-period exponential moving average of the MACD. The period of the signal line, like the MACD itself, can be changed to a value that might better suit your needs.
The crossing of the signal line is another way that trend can be determined:
- When MACD crosses above the signal line, a bullish response is expected.
- When MACD crosses below the signal line, a bearish response is expected.
These signals can occur regardless of the relationship to the zero line. However, a MACD crossing above the signal line while still in negative territory could indicate a reversal near a bottoming market; a MACD crossing below the signal line while above the zero line could be the start of a longer downtrend. For traders, the MACD crossing its signal line is the most common interpretation of the MACD for signal generation. (Figure 3)
An Aggressive Approach to Identifying Peaks and Troughs
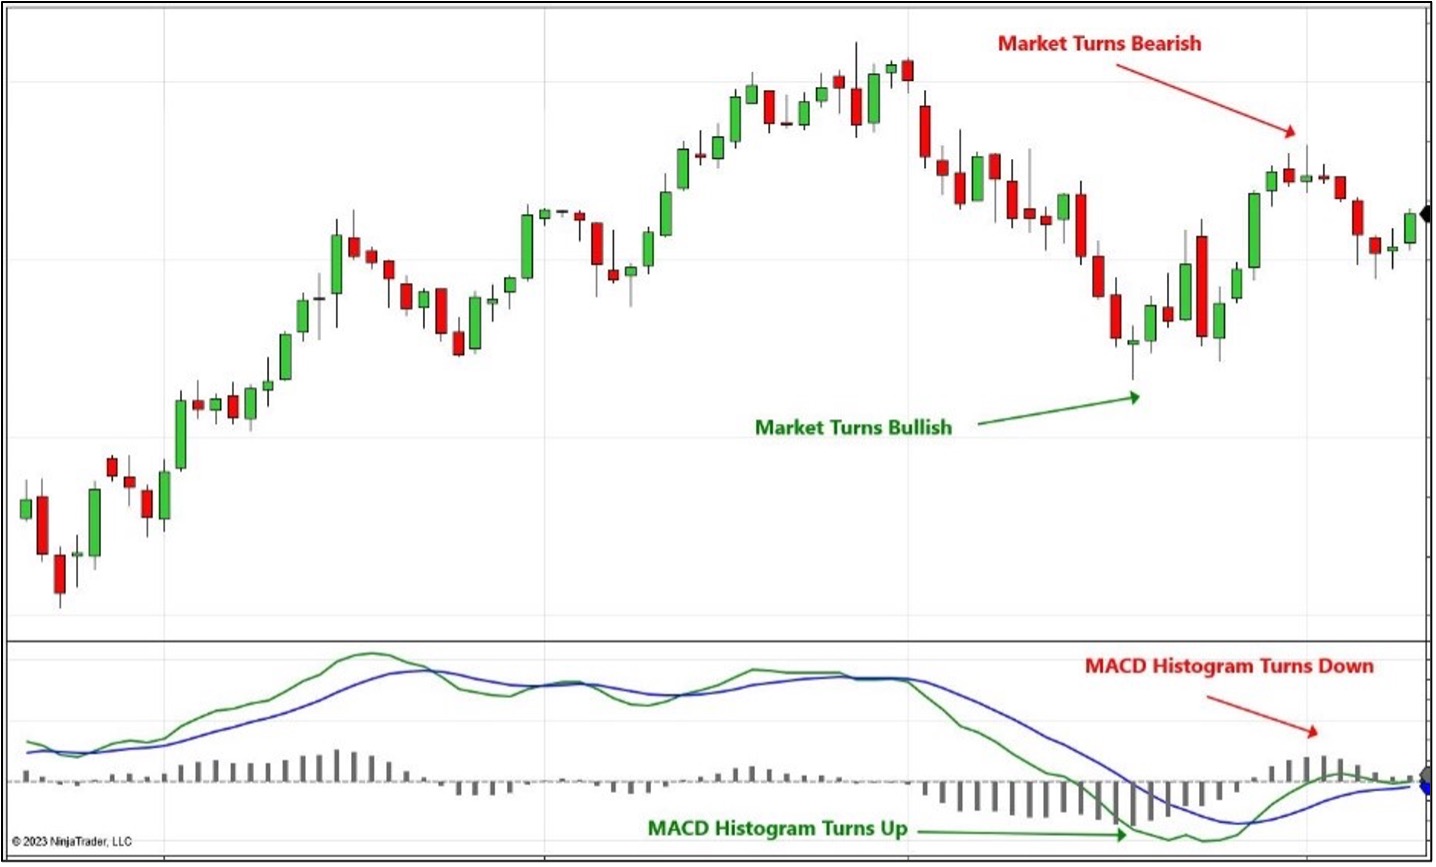
Just as he did using the two moving averages to form the MACD, Appel consolidated the MACD and its signal line into one data set by taking a difference of the two. The MACD histogram is found by subtracting the signal line from the MACD line. This also indicates bullishness and bearishness around the zero line.
An aggressive way of using the MACD histogram for trading signals is to identify when the histogram turns down when it is positive (to go short), and when the histogram turns up when it is negative (to go long). While these turns can occur closer to the peaks and troughs in the price chart, they can also generate false signals, and you can get whipsawed! (Figure 4)
Identifying Divergence
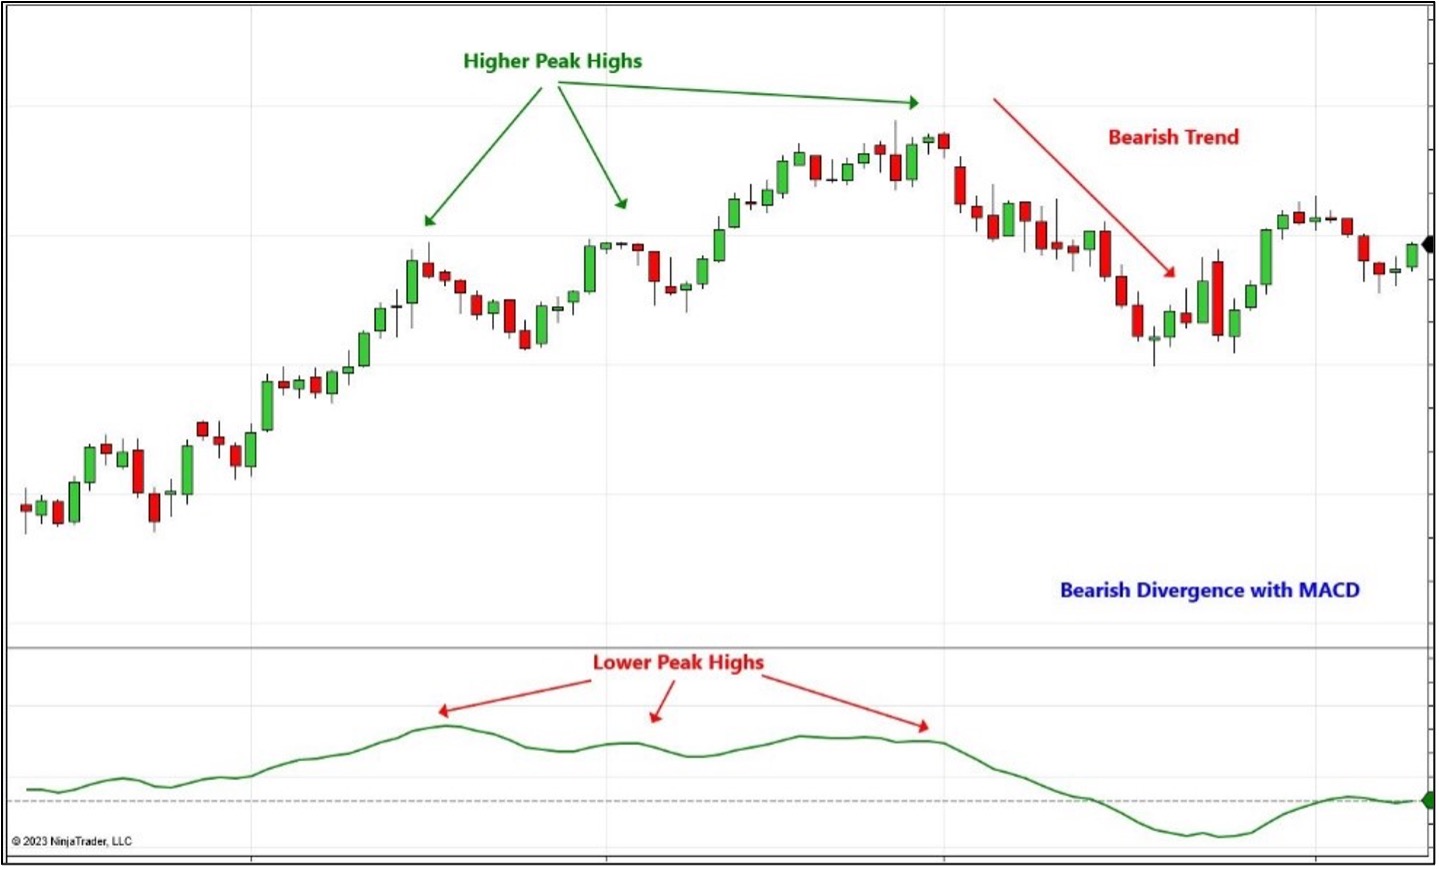
Another interpretation of the MACD is through divergence. Divergence is the concept that the trend on the price chart is not fully followed by the trend on the indicator. This usually means that while price is making higher peak highs, the indicator doesn’t make higher peak highs, showing weakness and a possibility that price trend will stall or reverse. This is called bearish divergence; the expectation is that the market will turn bearish if divergence is to be believed. Bullish divergence is identified as lower peak lows on price but as higher peak lows on the indicator. This is less actionable as the timing of a reversal is not definable—but could help you with a shorter-term trading bias. (Figure 5)
 =
=
The MACD indicator is an involved indicator that traders use to identify trend strength, trend change, and divergence. You can use it as a confirming tool or more actively as a signal generator. As with any technical indicator, MACD should not be the only technical tool you use to make trading decisions; using an indicator that focuses on price, volume, or volatility as a complement to MACD is strongly recommended.
Unlock Free Exclusive Training to Level Up Your Trading
Explore the foundational concepts of technical analysis with our free multi-video trading course “Technical Analysis Made Easy.” Learn how to analyze and anticipate market movements using market prices, volume data and more. To access this and other exclusive on-demand courses and educational content, sign up for your free NinjaTrader account today.
Plus, watch our daily livestream events as we prepare, analyze, and trade futures markets in real time.

