Coverage for the week of September 25 – September 29: In this week’s coverage, we analyze the pullbacks and downtrends in the E-mini Russell 2000, Micro bitcoin, soybean and natural gas futures. We also examine the economic reports expected next week.
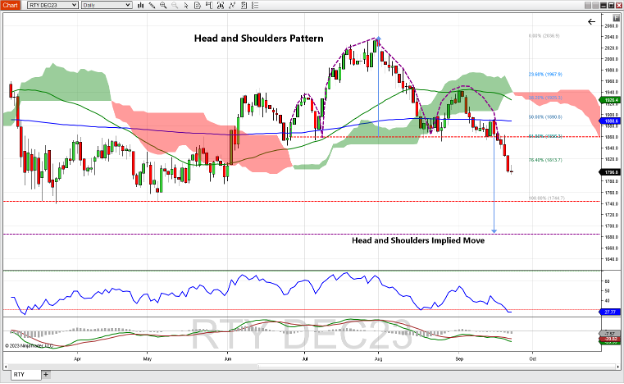
December E-Mini Russell 2000 Index Futures Daily Chart
December E-mini Russell 2000 Index futures completed its sixth consecutive down day on Friday, extending past the 76.4% Fibonacci retracement level as determined by the trend that began in early May and completed at the end of June. Monday’s close below 1,860 looks like a downside breach of the neckline of a head and shoulders pattern, which began in late June. Using a measured move from the neckline to the highest point on the head, Monday’s close below that neckline insinuates a target price of 1,865. The RSI closed below 30, indicating an oversold status. The MACD line stayed negative and the histogram is also trending down, indicating bearish status. Should this trend continue, possible support exists at previous lows (1,744) and at the head and shoulders implied target (1,685). If the trend reverses, resistance might be found at the 76% retracement level (1,813).

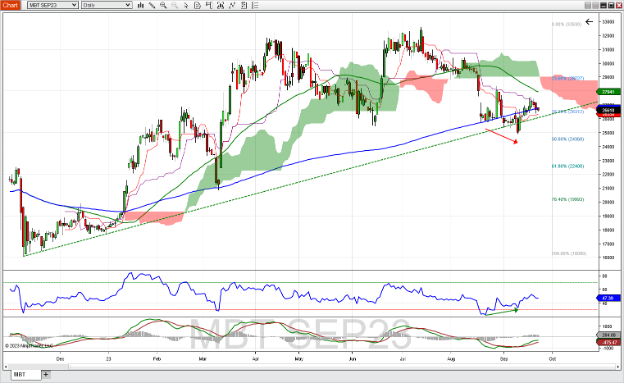
September Micro Bitcoin Futures Daily Chart
September Micro bitcoin futures finished last week unchanged, finding support at the 38.2% Fibonacci retracement level of the uptrend that started in early November 2022 and culminated in mid-July 2023, though closing below the 200-day moving average. While price is also below the 50-day moving average and the Ichimoku cloud, the RSI recently showed bullish divergence, with lower lows in bitcoin offset by higher lows in the RSI. The MACD shows mixed opinions as the histogram is positive but the MACD line itself is negative. Should this pullback continue possible support exists at the upward sloping trend line connecting lows from November and December of last year (~26,100). A rally might experience resistance at the 50-day moving average (~27,950).

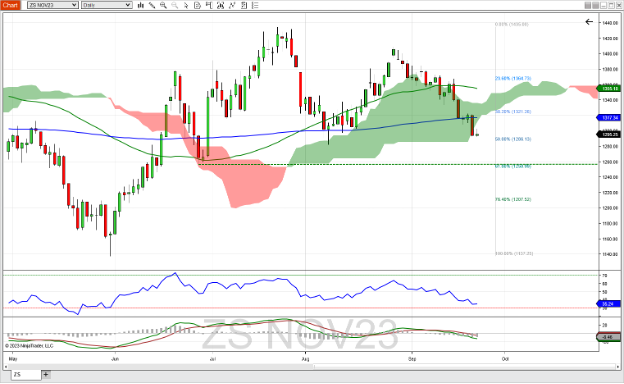
November Soybean Futures Daily Chart
November soybean futures continued its bearish trend, crossing below the 200-day moving average and below the bottom of the Ichimoku cloud, finding support at the 50% Fibonacci retracement level of the uptrend that started at the end of May and finished in late July. The RSI trends down with price nearing oversold levels, and the MACD is bearish in both the MACD line itself and the histogram. Should this trend continue, possible support exists at a previous low from June, which coincides with the 61.8% Fibonacci retracement level (~1,250). A rally this week might find resistance at the 200-day moving average which may intersect the bottom of the Ichimoku cloud (~1,321).

October Natural Gas Futures Daily Chart
October natural gas futures finished the week unchanged, though it did trade briefly above the 50-day moving average midweek. Natural gas shows a possible basing pattern starting back in February, with the lows of the base occurring in June, indicating possible (albeit slow) bullish activity ahead. While the RSI is neutral at almost 50, the MACD seems bearish as it is poised to cross below its signal line while negative. Should the bearish trend continue, support might exist at previous lows from early September (2.50). A rally in natural gas might find resistance at the 50-day moving average (~2.72) and the bottom of the Ichimoku cloud (2.78).

Commentary: With the Fed’s decision to keep rates unchanged, and Chair Powell suggesting that one more rate hike is not off the table, this week’s GDP report could give some insight into where the data may lead the Fed before the next FOMC meeting on November 1.
GDP drops on Thursday morning alongside the Jobless Claims report, which also could inject volatility into futures markets across most asset classes. Multiple housing reports (Case-Shiller and FHFA Price Indices on Tuesday morning, MBA Mortgages on Wednesday and Pending Home Sales on Thursday) provide insight into the housing portion of the economy, which is a substantial portion of the inflation calculation.
There is a higher than usual amount of surveyed sentiment reports, with Consumer Confidence at 10 AM ET Tuesday, Business Uncertainty at 11 AM ET Wednesday and University of Michigan’s Consumer Sentiment at 10 AM ET Friday.
Federal Reserve Presidents Thomas Barkin (Richmond) and John Williams (New York) are scheduled to speak Thursday, 7 PM ET and Friday 12:45 PM ET, respectively. Note that Federal Reserve Chair Powell, other Fed Bank presidents, and other Federal Reserve governors may have speaking opportunities that arise without notification, and their comments can introduce volatility to futures markets.
Economic Reports for the week of September 25 – September 29
| Date | Economic Reports |
|---|---|
| Monday, September 25 | 8:30 AM ET: Chicago Fed National Activity Index 10:30 AM ET: Dallas Fed Manufacturing Survey 11:00 AM ET: Export Inspections 3:00 PM ET: Cold Storage 4:00 PM ET: Crop Progress |
| Tuesday, September 26 | 9:00 AM ET: Case-Shiller Home Price Index 9:00 AM ET: FHFA House Price Index 10:00 AM ET: Consumer Confidence * 10:00 AM ET: New Home Sales 10:00 AM ET: Richmond Fed Manufacturing Index 1:00 PM ET: Money Supply 4:30 PM ET: API Weekly Oil Stocks |
| Wednesday, September 27 | 7:00 AM ET: MBA Mortgage Applications 8:00 AM ET: Bank Reserve Settlement 8:30 AM ET: Durable Goods Orders * 10:30 AM ET: EIA Petroleum Status Report * 11:00 AM ET: Survey of Business Uncertainty |
| Thursday, September 28 | 8:30 AM ET: Jobless Claims *** 8:30 AM ET: GDP *** 8:30 AM ET: Corporate Profits 8:30 AM ET: Export Sales 10:00 AM ET: Pending Home Sales Index 10:30 AM ET: EIA Natural Gas Report * 11:00 AM ET: Kansas City Fed Manufacturing Index 4:30 PM ET: Fed Balance Sheet @federalreserve 7:00 PM ET: Richmond Federal Reserve Bank President Thomas Barkin Speech @RichmondFed |
| Friday, September 29 | 8:30 AM ET: Personal Income and Outlays * 8:30 AM ET: International Trade in Goods and Services 8:30 AM ET: Wholesale Inventories (Advance) 8:30 AM ET: Retail Inventories (Advance) 9:45 AM ET: Chicago PMI 10:00 AM ET: Consumer Sentiment 12:00 PM ET: Grain Stocks 12:45 PM ET: New York Federal Reserve Bank President John Williams Speech 1:00 PM ET: Baker Hughes Rig Count 3:00 PM ET: Farm Prices |
*** Market Moving Indicators
* Merit Extra Attention
Ready For More?
Learn the basics of technical analysis with our free multi-video trading course, “Technical Analysis Made Easy.”
Join our daily livestream events as we prepare, analyze and trade the futures markets in real time.
Start Trading Futures With NinjaTrader
NinjaTrader supports more than 800,000 futures traders worldwide with our award-winning trading platforms, world-class support and futures brokerage services with $50 day trading margins. The NinjaTrader desktop platform is always free to use for advanced charting, strategy backtesting, technical analysis and trade simulation.
Get to know our:
- Futures brokerage: Open an account size of your choice—no deposit minimum required—and get free access to our desktop, web and mobile trading platforms.
- Free trading simulator: Sharpen your futures trading skills and test your ideas risk-free in our simulated trading environment with 14 days of livestreaming futures market data.
Better futures start now. Open your free account to access NinjaTrader’s award-winning trading platforms, plus premium training and exclusive daily market commentary.

