In the world of futures trading, where every tick represents money made or lost, understanding the richness and nuances of key market indicators is vital. Among these, Bollinger Bands stand out as a lighthouse for traders navigating the turbulent financial markets.
Let’s explore the value of the Bollinger Band indicator, its calculation, and its critical role in helping traders identify market sentiment, overbought and oversold conditions, and subtle and not so subtle changes in volatility.
What are Bollinger Bands?
The Bollinger Band is simple in its construction but firmly based on statistical mathematics. Created by John Bollinger in the 1980s, the indicator consists of three lines: •
- The middle average band is a simple moving average (SMA) of the closing prices (usually over 20 periods)
- One outer band that is plotted two standard deviations above the middle SMA
- One outer band that is plotted two standard deviations below the middle SMA
These standard deviations adjust dynamically with the market's volatility, expanding during volatile periods and contracting during less volatile times, thus encapsulating price movements in an envelope.
Using Bollinger Bands to Unlock Market Sentiment: Overbought and Oversold Conditions
One of the most common and compelling uses of Bollinger Bands is the ability to indicate overbought or oversold market conditions. When the price touches or breaches the upper band, the market is considered overbought, suggesting a potential pullback as traders take profits. Conversely, when prices touch or fall below the lower band, the market is deemed oversold, potentially heralding a bounce back as traders perceive value and begin buying. This dual functionality can provide traders with long and short entry and exit signals. (Figure 1)
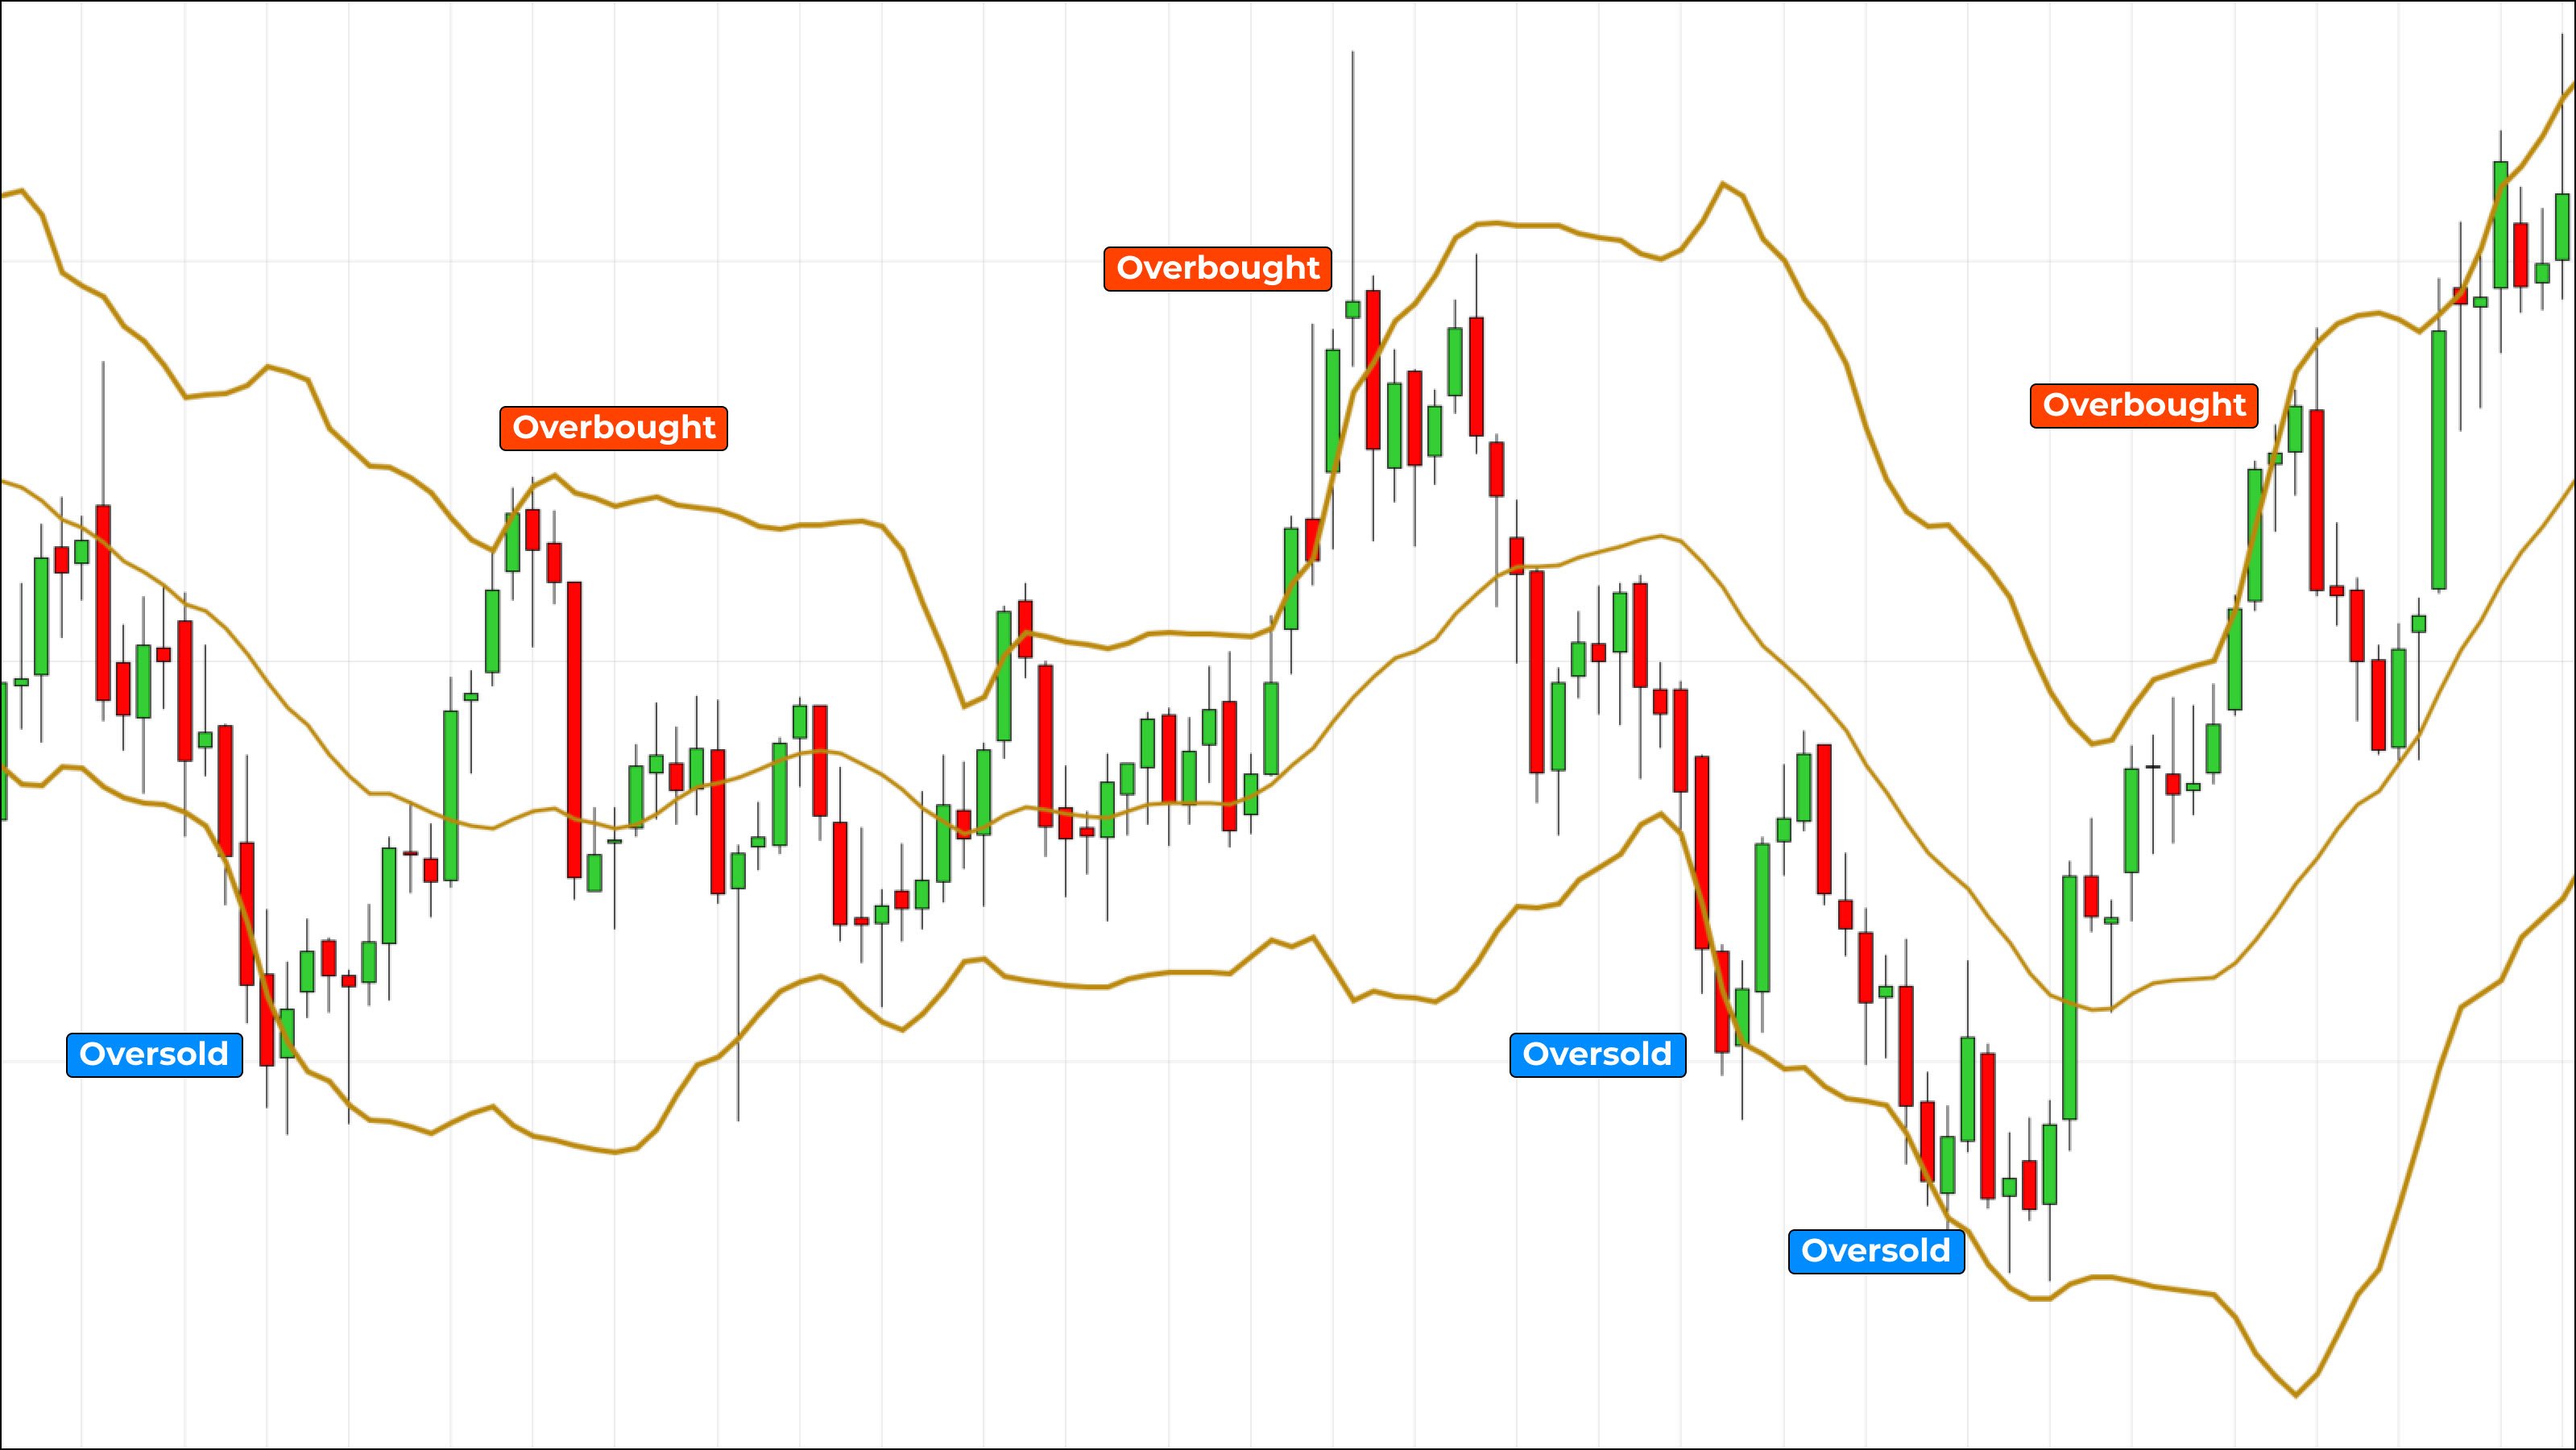 Figure 1: Bollinger Bands overbought and oversold indications
Volatility's Telltale Signs: Understanding Expansion and Contraction
Bollinger Bands are based on the concept of standard deviation and offer keen insights into market volatility. The distance between the upper and lower bands visually represents volatility:
- Wider expanding bands suggest increased volatility
- Narrow contracting bands indicate decreased volatility
The dynamic nature of the bands allows traders to better judge the market's variability and adjust their strategies accordingly. (Figure 2)
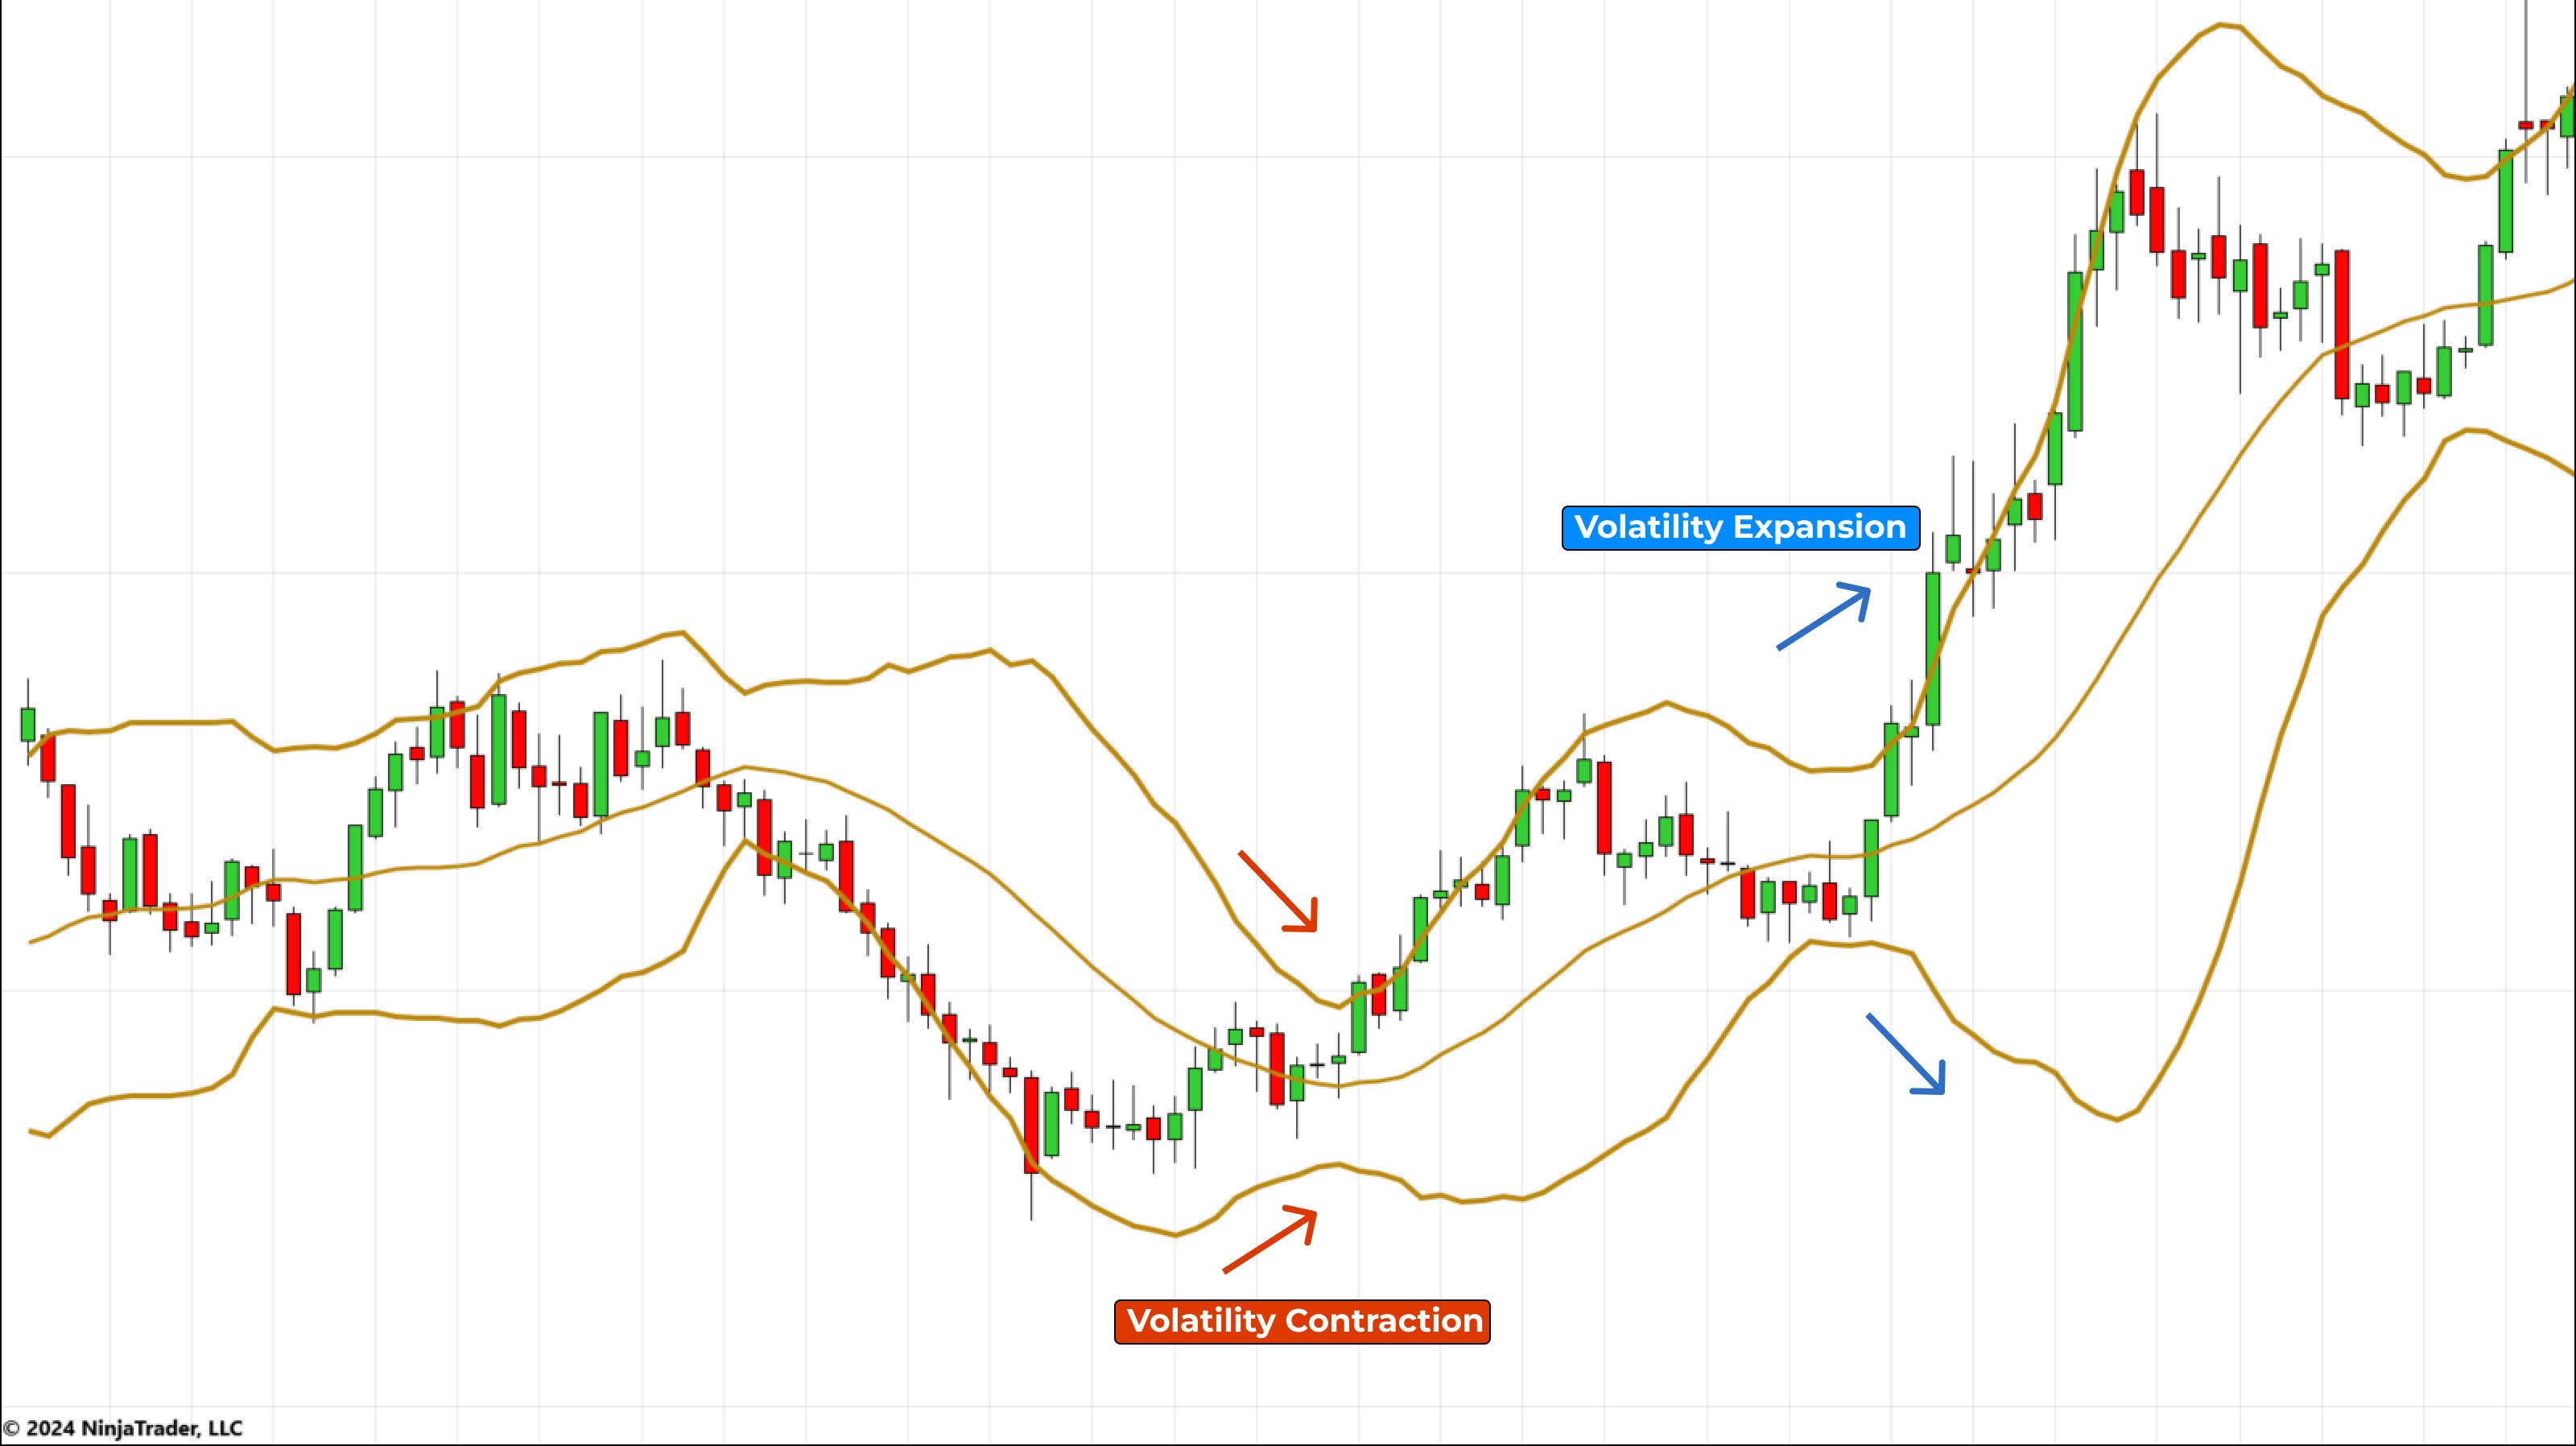 Figure 2: Bollinger Bands indicating volatility contracting and expanding
The Volatility Squeeze: Anticipating a Breakout
A particularly consistent phenomenon associated with Bollinger Bands is the “volatility squeeze.” This occurs when the bands tighten noticeably, signaling a significant decrease in volatility. Consider this as the calm before the storm. As the squeeze plays out, there are often substantial price breakouts above or below the recent prices, as low volatility periods are usually followed by increased market activity. (Figure 3)
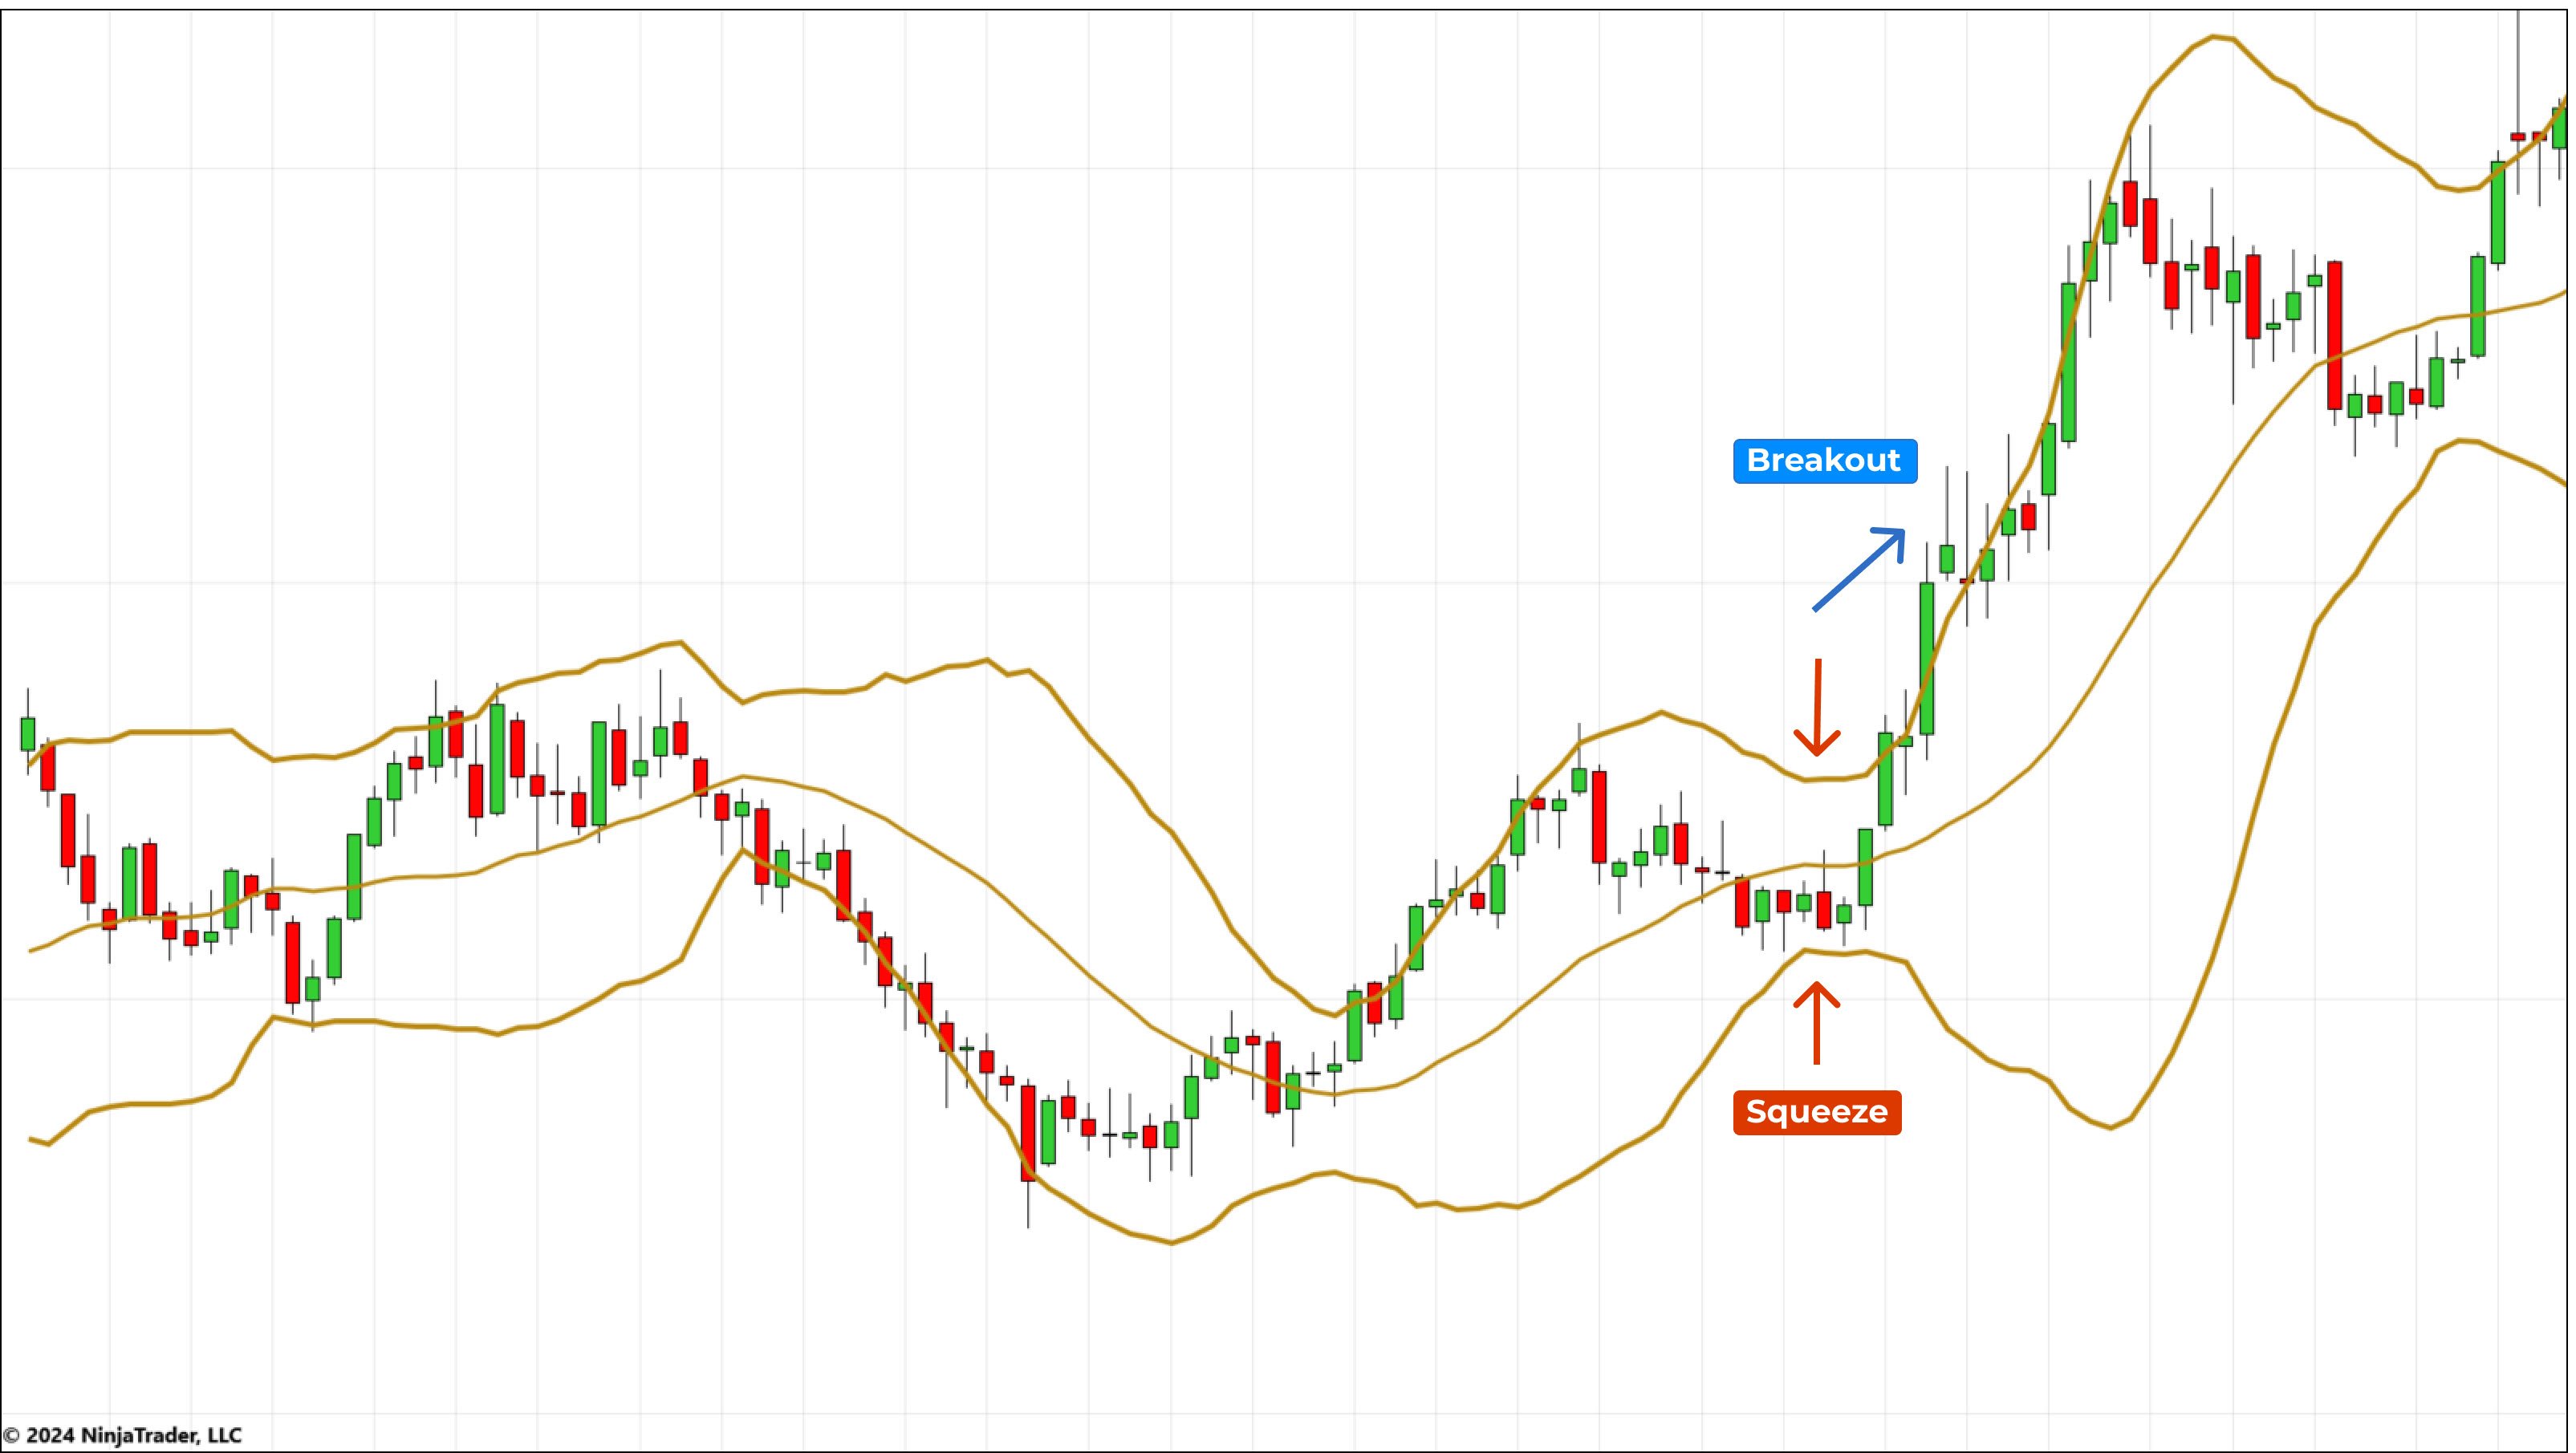 Figure 3: Bollinger Bands indicating volatility squeeze and the breakout
Trading Beyond the Bands: The Persistence of a Trend
While Bollinger Bands serve as a guide to price behavior, markets can trend outside the bands for extended periods of time. A market trending persistently above the upper band signifies strong bullish momentum, suggesting that the trend may continue despite being in the overbought territory. Similarly, a market that remains below the lower band indicates strong bearish momentum. (Figure 4)
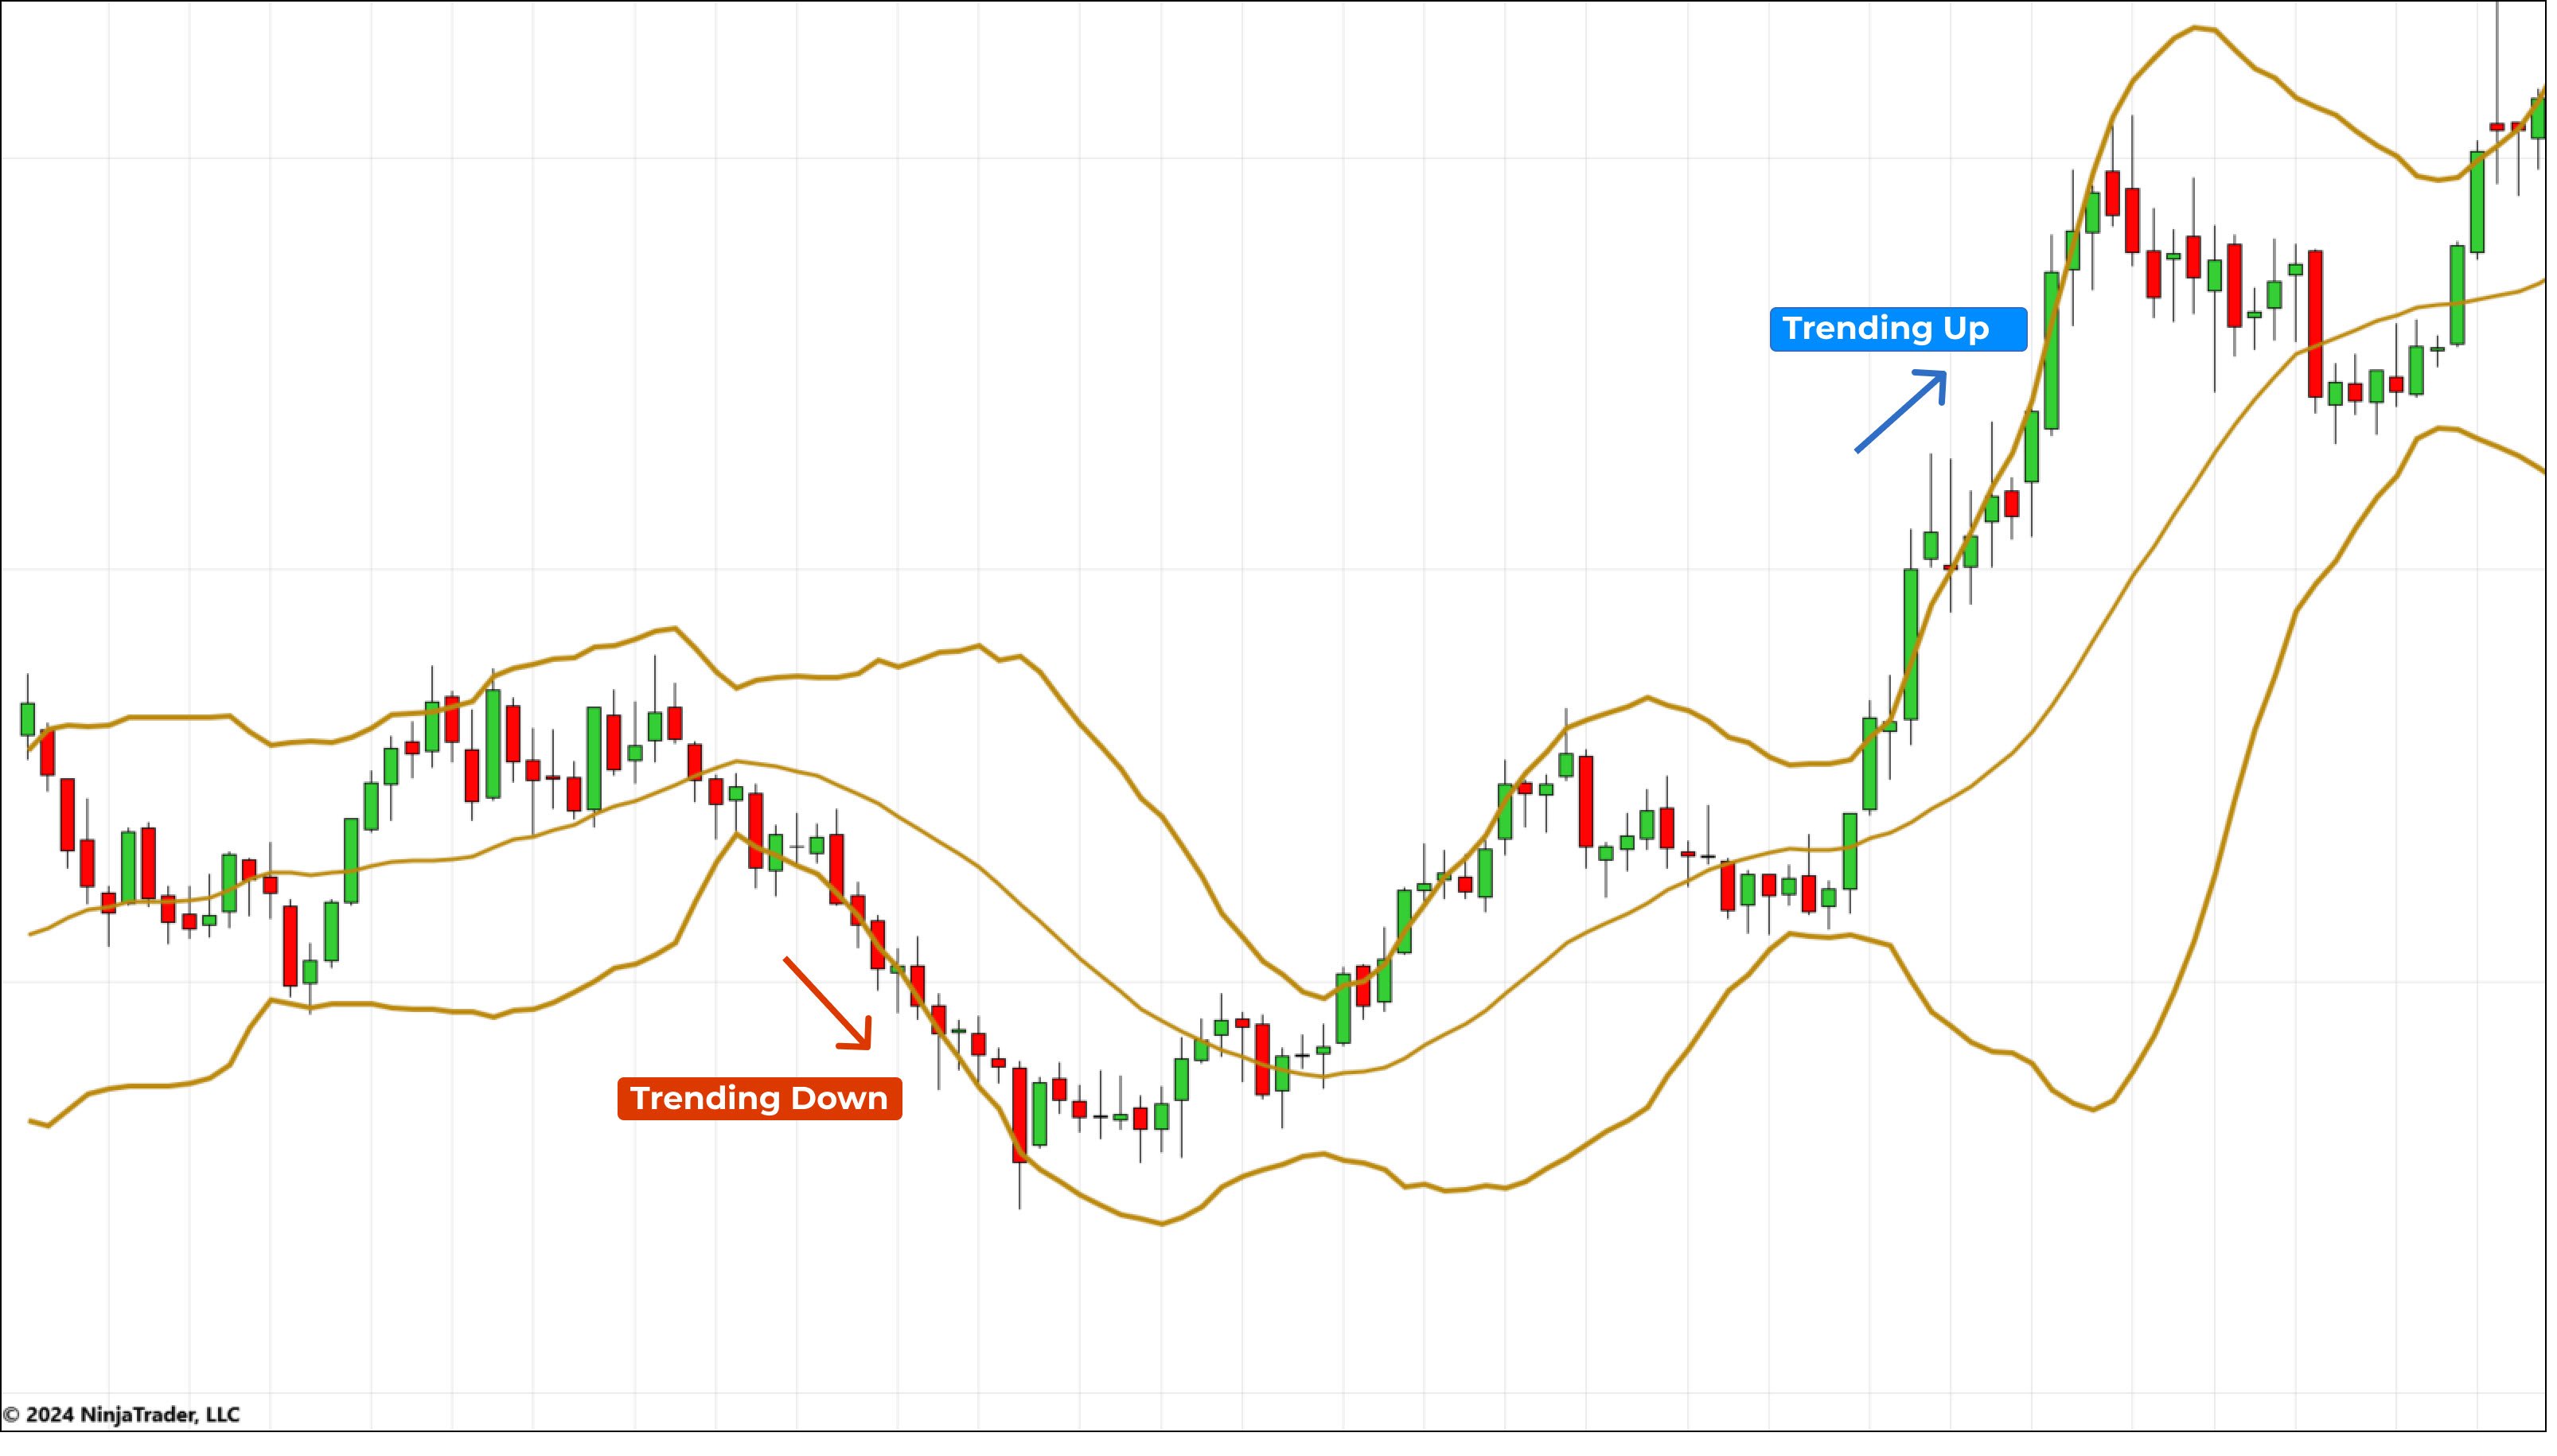 Figure 4: Bollinger Bands indicating the market can trend along the upper and lower bands
Add Bollinger Bands Strategies to Your Trader’s Toolkit
Bollinger Bands can provide key insights into market volatility, sentiment, and potential price reversals, and they are an invaluable resource in a trader's toolkit. However, as with all indicators, it’s beneficial to use Bollinger Bands in conjunction with other analysis tools to formulate a more multi-faceted trading strategy that’s right for you.
Monitoring time frames
Bollinger Bands can be especially helpful for monitoring different time frames:
- Daily and weekly charts can provide a broader context for market trends and volatility.
- Intraday charts (e.g., 10-minute or hourly) can help fine-tune entries and exits based on short-term movements.
- Market Analyzer tools in platforms like NinjaTrader can be configured to track Bollinger Band values across instruments in real time, helping traders quickly compare current price levels against band levels without switching between charts.
For example, you might spot narrowing bands on a daily chart, suggesting upcoming volatility. You could then shift to an intraday chart to look for breakout setups in line with your bias.
Adjusting key variables
Bollinger Bands aren’t one-size-fits-all. You can adjust key variables like: •
- Period length of the moving average (e.g., 14, 20, 50)
- Standard deviation settings (e.g., 1.5, 2, 3)
Shorter periods and lower deviations may increase sensitivity and generate more signals but also more false positives. Longer periods and wider bands tend to smooth out noise but may lag in response.
It’s also important to avoid relying on Bollinger Bands in isolation. They work best when combined with other indicators that measure momentum, volume, or trend strength.

Watch Bollinger Bands in action with NinjaTrader
Bollinger Bands offer a visual, flexible way to measure volatility and assess price behavior. By tailoring your setup and using them alongside other tools, you can gain better insights into futures market dynamics.
Want to see Bollinger Bands in action? Open a free NinjaTrader account and start practicing your technical analysis in our simulated environment.

Live Daily Market Analysis at Your Fingertips
Get ready for the trading day ahead as our experts prep, analyze, and trade the futures markets in real time during our daily livestream. Watch live here or catch what you missed on our YouTube channel.
