|
The Mini Data Box and Data Box are excellent tools that allow you to access both bar and indicator values on your chart. The Mini Data Box provides a compressed view of your chart data while the Data Box provides a comprehensive view of the data.

Opening the Mini Data Box
To access the Mini Data Box hover your mouse cursor over the chart panel you would like to see values from and then press down on your middle mouse button. After pressing and holding down your middle mouse button, the Mini Data Box will appear with all of the bar data (Date/Time, Open, etc). You can then optionally continue holding down your middle mouse button as you move to view values for other bars or release your middle mouse button to hide the Mini Data Box once more.
Mini Data Box Display
The Mini Data Box displays the Date/Time, Open, High, Low, Close and Volume information of the selected bar on the chart. This view is excellent for quick access to information on a specific bar.
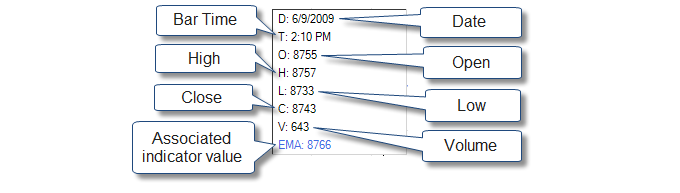
If you open the Mini Data Box in a panel that has indicators applied you will see the indicator values for the bar as well. The display order of data in the Mini Data Box is displayed as follows:
| • | The date will be displayed first |
| • | Indicators whose underlying input Data Series is NOT on the same panel will be listed first and sorted based on the vertical scale they reside on (Left, Right, then Overlay). |
| • | Data series will be listed next and sorted based on the vertical scale they reside on (Left, Right, then Overlay). |
| • | Underneath each Data Series, any associated indicators will be listed and sorted based on the vertical scale they reside on (Left, Right, then Overlay). |

If a panel contains more than one Data Series, each Data Series will be displayed with its own shade of black or gray and these shades will repeat after the fourth Data Series.
|
|
Opening a Data Box
The Data Box displays all bar data and indicator values based on your mouse cursor position. You can enable or disable this window via the right mouse click context menu, the "Show Data Box" chart toolbar icon, or by using the shortcut keys CTRL+D. If you have multiple charts open, the Data Box will display the values of the chart that your mouse cursor is currently hovering over. Being able to use one Data Box for multiple charts eliminates the need to open multiple Data Boxes and conserves monitor space.
Data Box Display
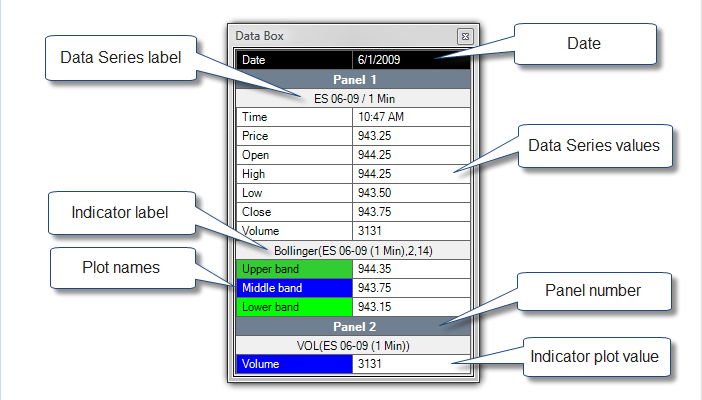
The Data Box (image below) displays the date, and then all Data Series and indicator information by panel number.
The display order of data in the Data Box is first grouped and sorted by panel number and then within each panel it is displayed as follows:
| • | Indicators whose underlying input Data Series is NOT on the same panel will be listed first and sorted based on the vertical scale they reside on (Left, Right, then Overlay). |
| • | Data Series will be listed next and sorted based on the vertical scale they reside on (Left, Right, then Overlay). |
| • | Underneath each Data Series, any associated indicators will be listed and sorted based on the vertical scale they reside on (Left, Right, then Overlay). |
As shown in the image below, Panel 1 shows the Data Series label as well as the Data Series values. The Data Series information is followed by the Indicator label, plot names, and values. Panel 2 lists the Indicator label, plot name, and indicator plot value.
Please note plots set to transparent, and Indicators or Data Series with the "Display in Data Box" parameter set to false will NOT be displayed in the Data Box.
Indicator Time Stamps on Multi-Series Charts
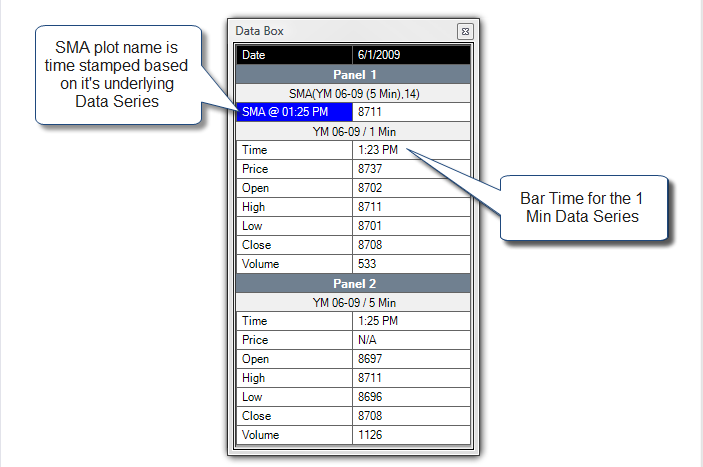
If an indicator is in a panel that does not include its underlying Data Series, the plot name will have a time stamp to indicate what bar time the corresponding value belongs to.
The second image on the right shows a one minute Data Series in Panel 1 and a five minute Data Series in Panel 2. However, the 14 period SMA (Simple Moving Average) of the five minute Data Series is being plotted on top of the one minute Data Series in Panel 1. Since the underlying Data Series of the SMA does NOT reside in Panel 1, the SMA value is not associated to the one minute time stamp and thus the correct time stamp is automatically added to the SMA plot name.
|
Data Box Options
To access the Data Box options press down on your right mouse button anywhere in the Data Box to access the context menu.
The following options are available:
Always On Top
|
When enabled will keep the Data Box as the top window in your workspace so the values are always visible
|
Auto Size
|
When enabled your data box will re-size as you move your cursor between charts to meet each chart's display requirements.
|
Show Data Series Labels
|
Enables or Disables the display of the Data Series labels
|
Show Indicator Labels
|
Enables or Disables the display of the Indicator labels
|
Show Panel Numbers
|
Enables or Disables the display of the Panel numbers
|
Font
|
Sets the Data Box text font
|
The column splitter can be re-sized by hovering your cursor until the sizing arrows appear. Once the sizing arrows are showing you can press down on your left mouse button and drag the column splitter to the desired location and then release the left mouse button.
|
|
|


