|
NinjaScript > Educational Resources > Tutorials > Indicators > Advanced - Custom Plot Colors via Thresholds > Entering Calculation Logic |

  
|
|
NinjaScript > Educational Resources > Tutorials > Indicators > Advanced - Custom Plot Colors via Thresholds > Entering Calculation Logic |
|
|
The OnBarUpdate() method is called for each incoming tick or on the close of a bar (user defined) when performing real-time calculations and is called on each bar of a data series when re-calculating the indicator. For example, an indicator would be re-calculated when adding it to an existing chart that has existing price data displayed. Therefore, this is the main method called for indicator calculation and we will use this method to enter the script that will calculate the ROC value.
Setting Plot Thresholds
The concept of setting threshold values is to set when and when not to paint a plot on the chart. In this indicator, we have an "AboveZero" plot with a default color of green which we only want to see when the value of ROC is above zero and a "BelowZero" plot with a default color of orangeRed which we only want to see when the value of ROC is below zero. In order to make that happen we have to set the threshold values of each plot.
Plots[0].Min = 0;
This statement says, in the collection of Plot objects, take the first one (Plots[0]) and set its minimum value to zero. This means any value below zero will not display.
Plots[1].Max = 0;
This statement says, in the collection of Plot objects, take the second one (Plots[1]) and set its maximum value to zero. This means any value above zero will not display.
We now have a simple plot switching mechanism that displays the correct colored line depending on if the value of ROC is above or below zero. In fact, you can take this concept a little bit farther. You can even set different plots style (bar, dot etc..) depending on threshold values.
A quick word about collections. Collections are objects that store a collection of objects, kind of like a container. In this case we are working with a collection of plots. In the above wizard generated code you will notice that we are adding new plots to the "Plots" collection. "AboveZero" was added first and then "BelowZero". This means that we can reference the "AboveZero" plot object through Plots[0]. The reason we don't pass in a value of 1 is because collections are zero based indexes. This means the first item has an index of 0, the second time an index of 1 and so forth.
Completing the Indicator
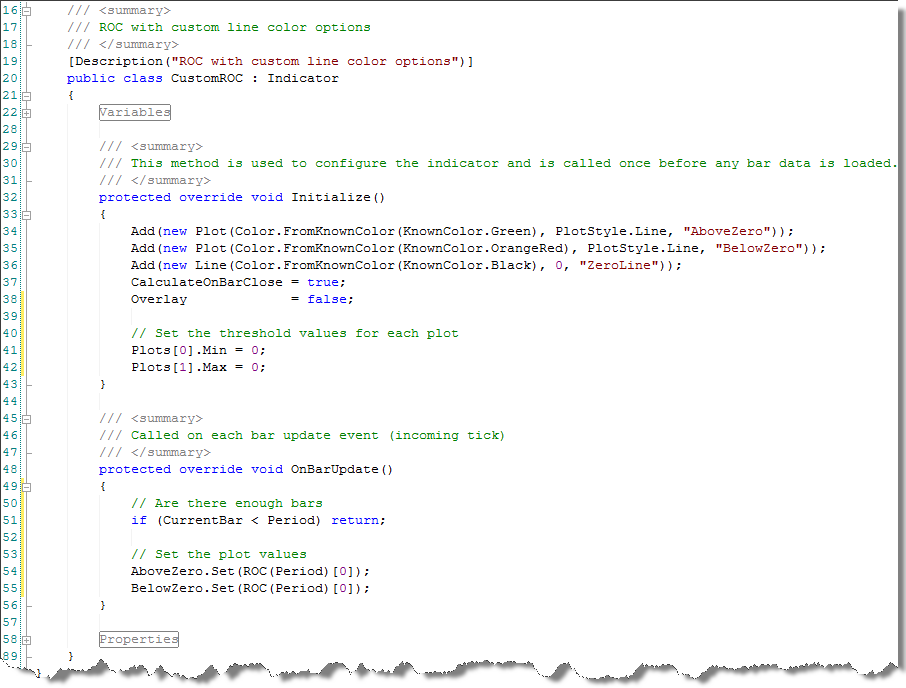
The calculation first checks to ensure there are enough bars to complete the calculation and then sets both plot lines to the ROC value.
The OnBarUpdate() method in your editor should look identical to the image below.
|