|
NinjaScript > Educational Resources > Tutorials > Indicators > Advanced - Custom Drawing > Entering Calculation Logic |

  
|
|
NinjaScript > Educational Resources > Tutorials > Indicators > Advanced - Custom Drawing > Entering Calculation Logic |
|
|
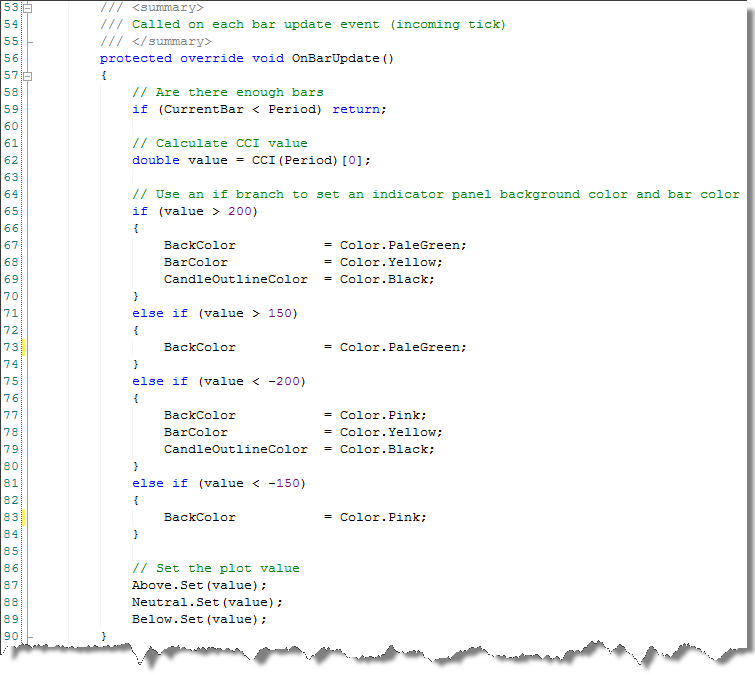
The OnBarUpdate() method is called for each incoming tick or on the close of a bar (user defined) when performing real-time calculations and is called on each bar of a data series when re-calculating the indicator. For example, an indicator would be re-calculated when adding it to an existing chart that has existing price data displayed. Therefore, this is the main method called for indicator calculation and we will use this method to enter the script that will calculate the CCI value and set the conditions used to set custom drawing.
Initializing the Indicator
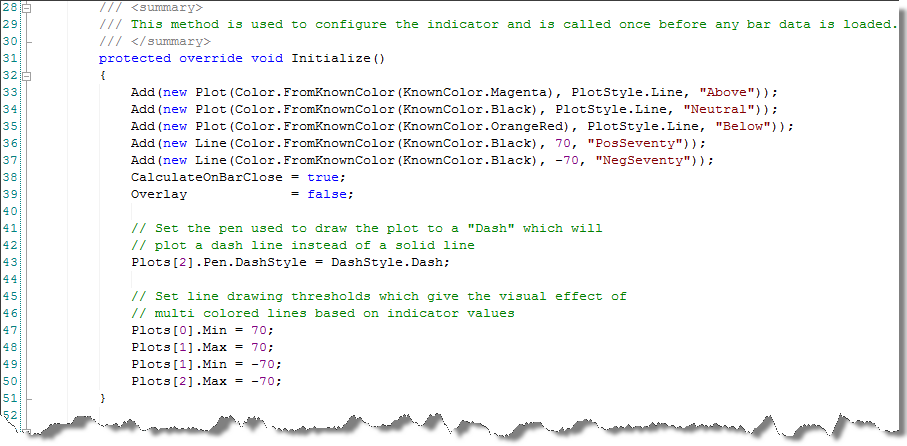
Enter the following code in the Initialize() method and below the wizard generated code:
The third plot named "Below" is of color OrangeRed and has a PlotStyle of line. The code above changes the DashStyle property of this line from a solid line to a dashed line. This is accomplished by accessing the plot via Plots[2] syntax. New plots are always added to the collection Plots in sequence. Based on the wizard generated code above, we can see that the plot named "Below" was the third added plot. Since collections are always zero based we pass in the value of 2 (plot 1 = 0, plot 2 = 1, plot 3 = 2 etc...) to then access the Pen used to draw the plot and change the DashStyle property. This is an advanced topic. Changing this property can be done by the user of the indicator directly within the Indicator Dialog window. You can read more about the Pen class here.
Enter the following code in the Initialize() method and below the code entered above:
The code above sets the plot threshold values. The concept of setting threshold values is to set when and when not to paint a plot on the chart. This topic was covered in greater detail in the "Custom Plot Colors via Thresholds" Tutorial.
Custom Drawing
The method first checks to ensure that there are enough bars to perform the calculation and then assigns the CCI value to the variable value. A multi case if statement is used to determine when to draw custom graphics.
if (value > 200) CandleOutlineColor = Color.Black;
The first branch checks if the value is greater than 200 and if true, sets the BackColor property to PaleGreen, sets the BarColor property to yellow, and also sets the CandleOutlineColor property to black.
BackColor sets the background color of the chart for the current bar. CandleOutlineColor sets the color of the outline of the current price bar.
A list of available colors can be found here.
Each successive else if branch checks the value of value and sets custom drawing properties.
Setting the plot values
To complete the indicator you must set the indicator value to each plot.
The Initialize() method in your editor should look identical to the image below:
The OnBarUpdate() method in your editor should look identical to the image below:
|