|
<< Click to Display Table of Contents >> ChartControl |


|
ChartControl
|
<< Click to Display Table of Contents >> ChartControl |
|
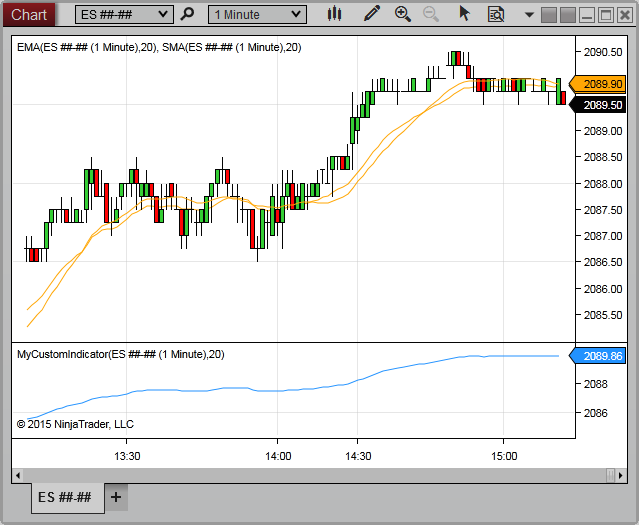
The ChartControl class provides access to a wide range of properties and methods related to the location of objects on a chart and other chart-related properties. The ChartControl object provides information related to the entire hosting grid of the chart, which overlap with the ChartPanel, ChartScale and ChartBars.
Note: The ChartControl object is ONLY guaranteed to be available when a NinjaScript type initiates from a Chart Window. There are situations where an indicator or strategy starts from another Windows (such as the Control Center's Strategies Grid, or from a Strategy Analyzer), where the ChartContol object is NOT accessible. Therefore, the ChartControl object should always be safely accessed (e.g., from within a try-catch, or conditionally using null reference checks) |
Warning: The ChartControl and its methods and properties should ONLY be access once the State has reached State.Historical |
Measures the distance (in pixels) between the x-axis and the top of the horizontal scroll bar |
|
Measures the distance (in pixels) between the y-axis and the left margin of a chart |
|
Measures the distance (in pixels) between the y-axis and the right margin of a chart |
|
Measures the margin to the left of each bar on the chart, in pixels |
|
Provides a collection of ChartBars objects currently configured on the chart |
|
Provides the type of bar spacing used for the primary Bars object on the chart |
|
Provides the period (interval) used for the primary Bars object on the chart |
|
Measures the value of the bar width set for the primary Bars object on the chart |
|
An array containing the values of the BarWidth properties of all Bars objects on the chart |
|
Indicates the x-coordinate (in pixels) of the beginning of the chart canvas area |
|
Indicates the x-coordinate (in pixels) of the end of the chart canvas area |
|
Indicates the current state of the Zoom tool on the chart |
|
Holds a collection of ChartPanel objects |
|
Indicates the Cross Hair type currently enabled on the chart |
|
Indicates a time value of the first bar painted on the chart |
|
Returns the width of the bars in the primary Bars object on the chart, in pixels |
|
Returns the slot index of the primary Bars object on the chart corresponding to a specified time value |
|
Returns the slot index of the primary Bars object on the chart corresponding to a specified x-coordinate on the visible chart canvas |
|
Returns a time value corresponding to a specified slot index of the primary Bars object on the chart |
|
Returns a time value related to the primary Bars' slot index at a specified x-coordinate on the chart canvas |
|
Returns the chart-canvas x-coordinate of the bar at a specified index of a specified ChartBars object on the chart |
|
Returns the chart-canvas x-coordinate of the slot index of the primary Bars object corresponding to a specified time |
|
Returns a collection of indicators currently configured on the chart |
|
Indicates the time-axis scroll arrow is visible in the top-right corner of the chart |
|
Indicates the Stay in Draw Mode is currently enabled on the chart |
|
Indicates the y-axis displays (in any chart panel) to the left side of the chart canvas |
|
Indicates an object on the chart is using the Overlay scale justification |
|
Indicates the y-axis displays (in any chart panel) to the right side of the chart canvas |
|
Indicates the slot index of the most recently painted bar on the primary Bars object configured on the chart |
|
Indicates the time of the most recently painted bar on the primary Bars object configured on the chart |
|
Indicates the x- and y-coordinates of the mouse cursor at the most recent OnMouseDown() event |
|
A collection of properties related to the configuration of the Chart |
|
Indicates the number of index slots in which bars are painted within the chart canvas area |
|
A collection of strategies configured on the chart |
|
Indicates the range of time in which bars are painted on the visible chart canvas |