
In this week’s coverage, we analyze the recent breakdowns in the Swiss franc and 10-year note markets, the rally in the Micro Nasdaq 100 Index, and the stall in the RBOB gasoline futures market. We also examine the economic reports expected next week.
Commentary and charts reflect data at the time of writing. Market conditions are subject to change and may not reflect all market activity.
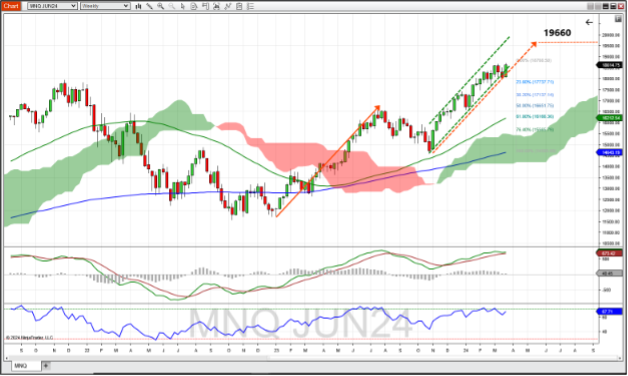
June Micro Nasdaq 100 Index Futures Daily Chart
June Micro Nasdaq 100 Index futures rallied last week, undoing two weeks of bullish activity and returning to the trend channel that began in October last year. The Nasdaq has recently shown some signs of weakness as it has been range bound between 18,000 and 18,600 for the past two months. Longer term price seems bullish as it trades well above its 52-week moving average, 200 week moving average, and the green, upward-sloping Ichimoku cloud. The MACD looked like it was about to show a bearish indication with recent weakness, but last week's trade lift gave a lift to the MACD, as well. RSI also gave a recent bearish signal by crossing below 70, but has quickly reversed trend, and aims at being overbought again with a current reading of 67+. Should this uptrend continue, an upside target of 19,660 is found by measuring the distance of the previous uptrend and applying it to the low of the current uptrend. If this market can’t remain in the current trend channel and breaks lower, support might be found at the 23.6% Fibonacci retracement level (~17,740) and further at the 38.2% Fib level (~17,140).
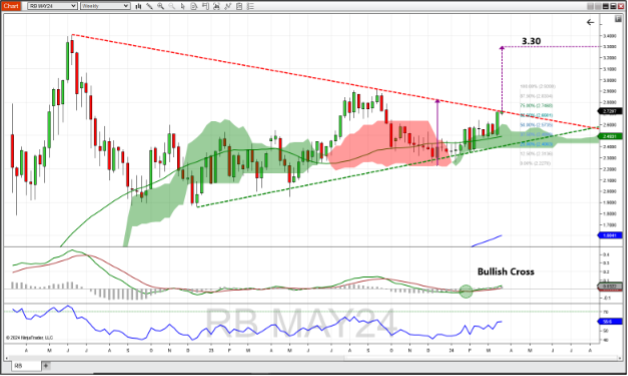
May RBOB Gasoline Futures Daily Chart
May RBOB gasoline futures continued to be restrained by a downward sloping trend line formed by connecting the high from June 2022 to the high of September 2023. This looks to be the upper edge of a triangle formation that's complemented by its supportive trend line connecting lows from December 2022 to lows in mid-2023. Price has been supported recently by the top of the Ichimoku cloud, as well as the 52-week moving average ever since the MACD showed a bullish cross back in January. RSI is trading along with price and is slowly edging toward the overbought end of the scale, at 59 plus. A breakout above the triangle implies a short-term move formed by connecting the lows of the recent test to the top of the triangle. This measured move implies an upside target of 3.30, which would fall just short of the 3.40 high seen in mid-2022. If this market turns around support might be found at the top of the Ichimoku cloud (~2.60) and further down at the bottom of the triangle formation (~2.45).
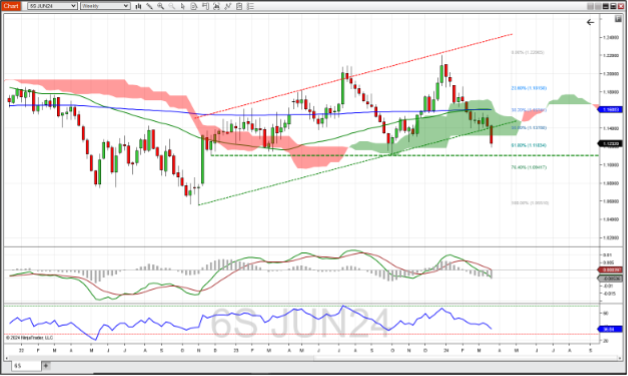
June Swiss Franc Futures Weekly Chart
June Swiss franc futures declined sharply last week, as they broke below the supportive trend line formed by connecting lows from October 2022 and September 2023. They also broke out of the Ichimoku cloud to the downside–another bearish indication. The MACD continues to trend downward after giving a bearish signal when price was at the top of the Ichimoku cloud. RSI is trending along with price, and at 36 it is getting close to the oversold level of 30. Should the 10-year note continue its downtrend, support might be found at 1.11, which has held as support after price broke above it in November 2022. A return to a bull trend might see resistance at the bottom of the Ichimoku cloud (~1.132) as well as the supportive trend line mentioned before (~1.142).
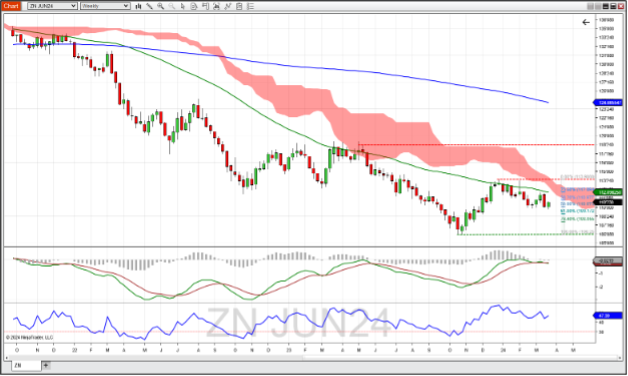
10-Year Note Futures Weekly Chart
10-year note futures saw a little bit of retracement last week, finding support at the 109’22 level that has been support for the last six weeks. This follows a reflection off the 52-week moving average, which has held as resistance for the last two years. 10-year note futures are also trading below a descending Ichimoku cloud, which is a bearish situation. The MACD study reflects an indecisive market as it trades around its signal line, never straying too far from zero in the last month. The RSI is trading in line with price, and is neutral at a reading of 47. If last week's rally fails to hold, this market might see support at the 61.8% Fibonacci retracement level of the previous up move which began in October 2023, and ended at the end of December (~109’5). Testing the lows of last year would mean a return to 106’08. Resistance might be found at the intersection of the 52-week moving average bottom of the Ichimoku cloud and the 23.6% fib level (~112’3).
Economic Reports for the week of March 25 – March 29
Because of the Good Friday holiday this week, check with the exchange for shortened trading hours as the underlying markets are most likely closed. For the same reason, reports that normally arrive Friday will be a day early (Consumer Sentiment, Baker Hughes Rig Count). Notable reports dropping this week include GDP for Q4 2023 on Thursday morning, expected to be 3.2% and will be the final number.
Jobless Claims on Thursday morning is expected to be unchanged at 211k claims. Reports that cover the production side of the economy include the Dallas Fed Manufacturing Index on Monday, Richmond Fed Manufacturing Index on Tuesday, and the Kansas City Fed Manufacturing Index on Thursday.
Friday morning will see some activity despite the holiday as we will learn about Retail and Wholesale Inventories, International Trade in Goods, and Personal Income and Outlays (which contains the PCE data that the Fed keeps a close eye on). Fed speakers begin to make speaking appearances, with Fed Presidents Raphael Bostic and Mary Daly, Governors Cook and Waller and Chair Powell himself speaking on Good Friday. As always when we aren’t in the Fed quiet period, other Fed presidents and governors may have comments or speaking engagements that are not scheduled at the time of this writing.
| Date | Economic Reports |
|---|---|
| Monday, March 25 | 8:25 AM ET: Raphael Bostic Speaks 8:30 AM ET: Chicago Fed National Activity Index 10:00 AM ET: New Home Sales 10:30 AM ET: Dallas Fed Manufacturing Survey 10:30 AM ET: Fed Reserve Governor Lisa Cook Speaks 11:00 AM ET: Export Inspections 3:00 PM ET: Cold Storage |
| Tuesday, March 26 | 8:30 AM ET: Durable Goods Orders 9:00 AM ET: FHFA House Price Index 9:00 AM ET: Case-Shiller Home Price Index 10:00 AM ET: Consumer Confidence 10:00 AM ET: Richmond Fed Manufacturing Index 1:00 PM ET: Money Supply 4:30 PM ET: API Weekly Oil Stocks |
| Wednesday, March 27 | 7:00 AM ET: MBA Mortgage Applications 10:30 AM ET: EIA Petroleum Status Report * 6:00 PM ET: Fed Reserve Governor Christopher J. Waller Speaks |
| Thursday, March 28 | 8:30 AM ET: Jobless Claims*** 8:30 AM ET: GDP *** 8:30 AM ET: Corporate Profits 8:30 AM ET: Export Sales 9:45 AM ET: Chicago PMI 10:00 AM ET: Consumer Sentiment 10:00 AM ET: Pending Home Sales 10:30 AM ET: EIA Natural Gas Report 11:00 AM ET: Kansas City Fed Manufacturing Index 12:00 PM ET: Grain Stocks 12:00 PM ET: Prospective Plantings 1:00 PM ET: Baker Hughes Rig Count 3:00 PM ET: Farm Prices 3:00 PM ET: Hogs & Pigs 4:30 PM ET: Fed Balance Sheet |
| Friday, March 29 | 8:30 AM ET: International Trade in Goods (Advance) 8:30 AM ET: Personal Income and Outlays 8:30 AM ET: Retail Inventories (Advance) 8:30 AM ET: Wholesale Inventories (Advance) 11:20 AM ET: San Francisco Fed Reserve Bank President Mary Daly Speaks 11:30 AM ET: Federal Reserve Chair Jerome Powell Speaks |
*** Market Moving Indicators
* Merit Extra Attention
Daily Futures Market Prep and Analysis With the Pros
Interact with our experts and other futures traders during daily livestreams as we analyze the markets in real time and explore our award-winning desktop platform. Log in here.
Trade Futures With Us
Sign up for your free NinjaTrader account today to start your 14-day trial of live simulated futures trading.
