The Ichimoku Cloud, also referred to by its actual name—“Ichimoku Kinko Hyo” (which translates to “one glance equilibrium chart”)—is a technical indicator championed by traders around the world. With just one glance, this comprehensive tool provides market insights into trend direction, momentum, and key support and resistance levels while futures trading.
Learn How To Use The Ichimoku Cloud In Your Futures Trading
Who created the Ichimoku Cloud?
Japanese journalist Goichi Hosoda began developing the Ichimoku Cloud in the late 1930s, eventually publishing his work in the late 1960s. With the advent of computer charting and technical analysis, the Ichimoku Cloud gained popularity quickly in the West, with many additional books published on the subject.
What does the Ichimoku Cloud tell me?
The Ichimoku Cloud comprises five main elements, each providing unique insights into price action and market sentiment. Developed originally on weekly data, the Ichimoku Cloud can be used on any market at any time frame. Here are the five Ichimoku Cloud elements, default parameters, and what each element represents (Figure 1).
Conversion Line (Tenkan-sen)
- Calculation: Average of the highest high and the lowest low over the last 9 periods.
- Description: It represents short-term price momentum.
Base Line (Kijun-sen)
- Calculation: Average of the highest high and the lowest low over the last 26 periods.
- Description: It represents medium-term price momentum.
Leading Span A (Senkou Span A)
- Calculation: Average of the Conversion Line and the Base Line, displaced 26 periods ahead.
- Description: The first of two boundaries of the cloud. It calculates the midpoint between the Conversion Line and Base Line but is displaced into the future, acting as a potential future support or resistance level.
Leading Span B (Senkou Span B)
- Calculation: Average of the highest high and the lowest low over the last 52 periods, displaced 26 periods ahead.
- Description: The second boundary of the cloud. It represents a longer-term momentum and acts as a potential future support or resistance level.
Lagging Span (Chikou Span):
- Calculation: Today’s closing price displaced 26 periods behind.
- Description: It offers a historical perspective on price action.

Figure 1. Ichimoku Cloud study
How Futures Traders Use Ichimoku Cloud Elements
The elements of the Ichimoku Cloud can help identify directional trend as well as dynamic levels of support and resistance. Here are a few ways traders use the cloud in their market analysis.
The current price in relationship to the Ichimoku Cloud is a vital indicator. When the price is above and moving further away from the cloud, it may indicate a strong bullish trend; if the price is below and moving away, it can indicate a strong bearish trend. Prices moving within the cloud may suggest the potential for a trend change or a period of consolidation. (Figure 2)

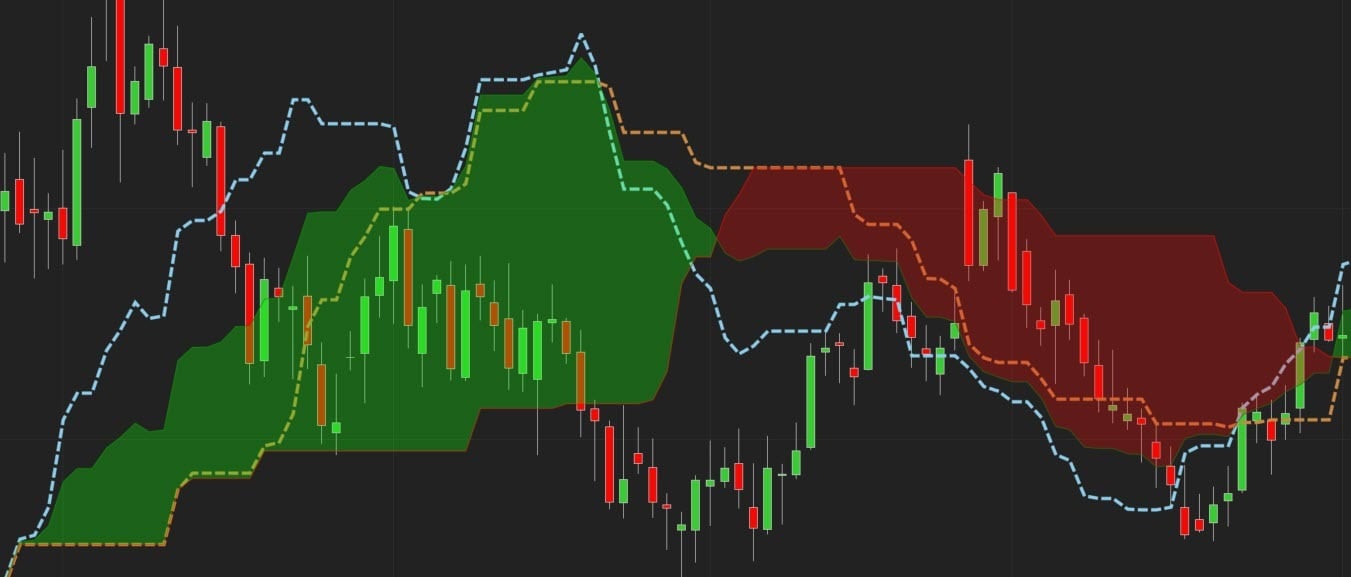
The color of the cloud is an easy way to spot directional sentiment: a green cloud suggests a bullish bias and red suggests a bearish bias. At the point where colors shift from red to green or vice versa, the directional sentiment may be changing. (Figure 3)

Figure 3. The color of the Ichimoku Cloud indicates bullish or bearish sentiment.
- Bullish Support Levels: When the price is above the cloud, the top boundary of the cloud can act as the first level of support, while the bottom acts as the final level of support.
- Bearish Resistance Levels: When the price is below the cloud, the bottom boundary of the cloud can act as the first level of resistance, while the top acts as the final level of resistance.
When the current price is inside the cloud, the market is generally considered range-bound or in transition. In this scenario, the boundaries can flip roles between support and resistance as the price oscillates within the cloud.
The cloud's thickness also often indicates the strength of the support or resistance levels. A thicker cloud might offer stronger support in a bullish trend or firmer resistance in a bearish trend. If the price breaks through a thick cloud, it could be a sign of a strong momentum shift. (Figure 4)

When the cloud twists from red to green or green to red, it can indicate potential trend reversal, with the area around the twist often being a zone of weak support or resistance.
Using the Conversion Line and Base Line in the Ichimoku Cloud
The Conversion Line and Base Line provide another way the Ichimoku Cloud can help traders determine the trend or directional bias of a market. Sometimes considered Ichimoku's version of two moving averages, a bullish mode is observed when the Conversion Line is above or crosses above the Base Line, and a bearish signal is observed when the Conversion Line is below or crosses below the Base Line. (Figure 5)

Finally, the Lagging Span is a momentum indicator comparing the current price to the price from 26 periods ago. If the current price is above the price 26 periods ago, that is bullish; if the current price is below the price of 26 periods ago, that is bearish.
Using the Ichimoku Cloud In Your Futures Trading
To harness the full potential of the Ichimoku Cloud, traders will often confirm its trend indication and support and resistance levels with other technical tools and time frames, providing traders with a more dynamic, well-rounded view of the market and allowing them to make better, more informed decisions for entries, exits, and stop order placements.
Download the Ichimoku Cloud Indicator
Try adding the Ichimoku Cloud to your futures trading strategy. This indicator is available for the NinjaTrader desktop platform and can be downloaded here.
Unlock Free Exclusive Training to Level Up Your Trading
Explore the foundational concepts of technical analysis with our free multi-video trading course “Technical Analysis Made Easy.” Learn how to analyze and anticipate market movements using market prices, volume data and more. To access this and other exclusive on-demand courses and educational content, sign up for your free NinjaTrader account today.
Plus, watch our daily livestream events as we prepare, analyze, and trade futures markets in real time.
