Whether you are a trend trader or counter trend trader, your ultimate success may depend on recognizing when there is potential for a trend to change. A popular way of identifying trend change is using momentum indicators, which measure whether the current price trend is strong or weak. The most widely accepted technical indicator to measure momentum in futures trading is the Relative Strength Index (RSI).
Learn How To Use The Relative Strength Index For Futures Trading
What is the Relative Strength Index Indicator?
The RSI indicator was developed by J. Welles Wilder Jr. in the late 1970s. Wilder recognized that when price moves up very quickly, it can be considered overbought at some level, meaning that there are too many long traders at the current price who will want to take profits and sell, or there are just not enough new buyers to sustain the trend.
Similarly, when price falls quickly, it can become oversold. When these extreme situations occur, a trend reversal is expected. So Wilder created the RSI with two goals in mind:
- to provide an easy way to understand overbought/oversold conditions, and
- to normalize the study so it can be applied to any market, regardless of underlying price or bar interval (Figure 1).
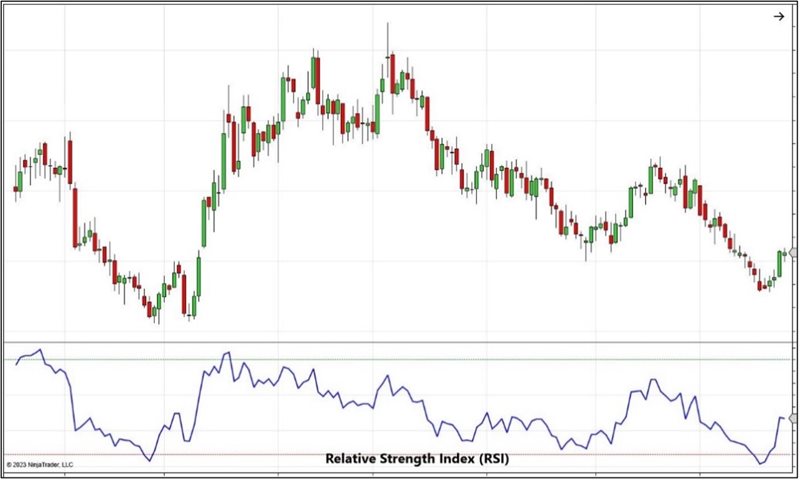
Figure 1: Relative Strength Index
Wilder presumed that in an uptrend, there would be more bar up closes (current close is greater than previous close) than down closes (current close is less than previous close). Conversely, he presumed that in a downtrend, there would be more down closes than up closes. Wilder recognized that both the number of up/down closes and the magnitude of those closes were important.
How to calculate RSI
The first step in determining the RSI is to measure up moves and down moves for a certain lookback period. The "moves" are found by subtracting the previous close from the current close; if the difference is positive, it is considered an up close, and if its negative, a down close.
The RSI is a ratio found by calculating a 14-bar exponential moving average (EMA) of the up closes over a 14-bar EMA of the down closes. Wilder normalized the calculations so that the values fall between 0 and 100, with a value over 70 considered overbought and a value under 30 considered oversold.
Although Wilder published his work with a default parameter of 14 daily bars for the EMA lookback period, traders are encouraged to experiment with different lookback parameters, bar intervals, and overbought oversold levels to better account for current market conditions in the symbols they are trading.
Using Overbought/Oversold Levels for Signals
When a downtrend extends for a long enough time, the RSI may show oversold readings of 30 or lower. This information is interesting but not always actionable. While it’s nice to know if the market is oversold, it doesn’t indicate that a mean reversion will happen immediately. In fact, with a long enough downtrend, the RSI can stay oversold for multiple bars. What is of interest to a trader is when the RSI crosses back above the oversold level, as this may indicate the beginning of an opposite bullish trend. (Figure 2)
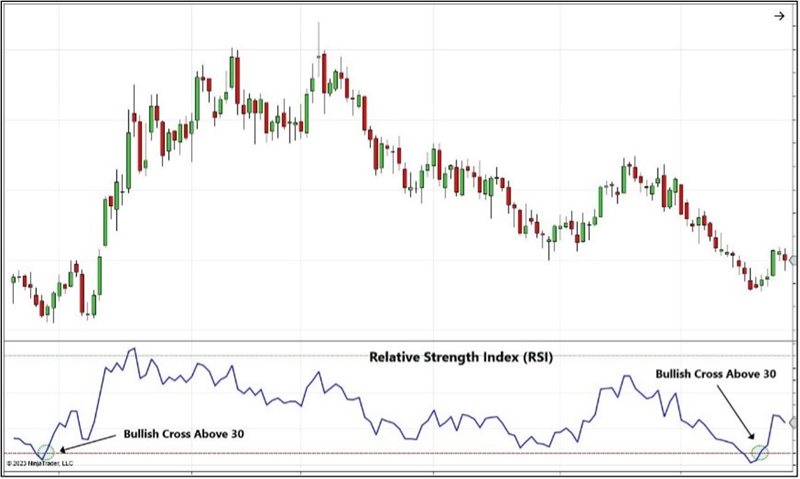
Figure 2: A Bullish Relative Strength Index Cross Above 30
Likewise, an uptrend can stay overbought for multiple bars, which will be indicated on the RSI as staying above the overbought level of 70. Again, what is notable here is when the RSI crosses back below 70, it may indicate the beginning of a bearish trend. (Figure 3)
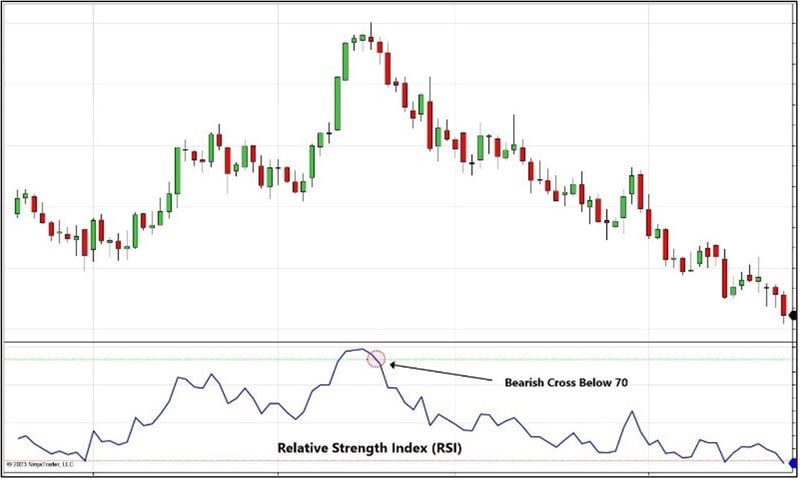
Figure 3: A Bearish Relative Strength Index Cross Below 70
Identifying Divergence
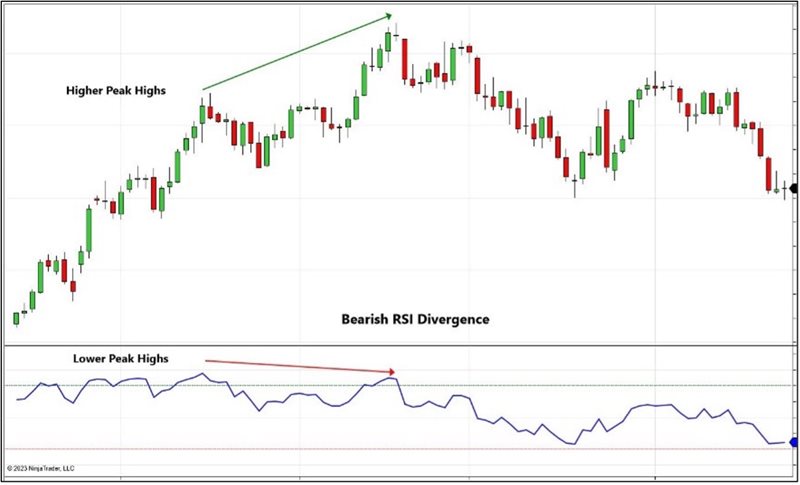
The RSI tends to move in tandem with the price bars; however, if the price bars are making higher highs and the RSI indicator is making lower highs, this condition is called bearish divergence. Bearish divergence may reflect weakening momentum, where the price action has not yet caught up but may eventually reverse to the downside. (Figure 4)
Bullish divergence reflects the opposite conditions, where price bars are making lower peak lows but RSI values are making higher peak lows. This may suggest that the downtrend is changing and that price may make a turn to the upside. (Figure 5)
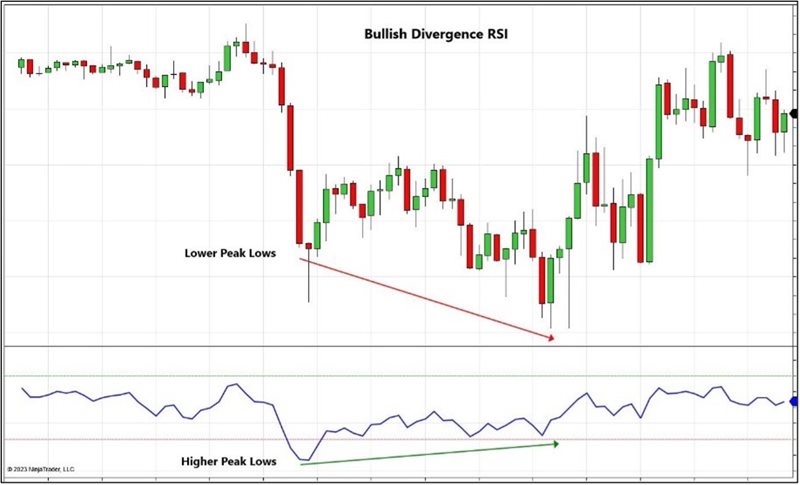
Figure 5: Identifying Bullish Divergence With Relative Strength Index
Using Relative Strength Index with your futures trading
RSI can be a useful indicator to determine the current directional bias (bullish/bearish); identify trading setups and triggers; and, with the use of divergence, warn of possible trend reversal. Combine RSI with your favorite volatility and volume indicators to help give you a more well-rounded picture of the market, and you’ll be on your way to making better, more informed futures trading decisions.
With RSI, Wilder created a valuable, easily understandable indicator that can be applied to any market and in any time frame. By any measure, the RSI indicator is a significant technical analysis achievement that has stood the test of time. Wilder’s classic book “New Concepts in Technical Trading Systems” is a must-read for anyone who is a student of technical analysis.
Unlock Free Exclusive Training to Level Up Your Trading
Explore the foundational concepts of technical analysis with our free multi-video trading course “Technical Analysis Made Easy.” Learn how to analyze and anticipate market movements using market prices, volume data and more. To access this and other exclusive on-demand courses and educational content, sign up for your free NinjaTrader account today.
Plus, watch our daily livestream events as we prepare, analyze, and trade futures markets in real time.

