
What Are Chart Patterns in Futures Trading?
Chart patterns are unique bar formations in a price chart that identify a potential trading opportunity in a futures market. There are dozens of recognizable chart patterns that futures traders can employ to help signal trend reversals or price breakouts.
Chart patterns can be as simple as a two-bar “inside bar” or “outside bar“ pattern or as complex as multi-bar “head and shoulders” or “cup and handle” patterns. Having an understanding of which basic charts patterns to look for will help you expand your analysis skills.
Three Starting Chart Patterns for Futures Traders
Please be aware that not every pattern seen in a chart will fit exactly into the textbook description of that pattern. Traders need to use their own judgment and understand that variation is possible.
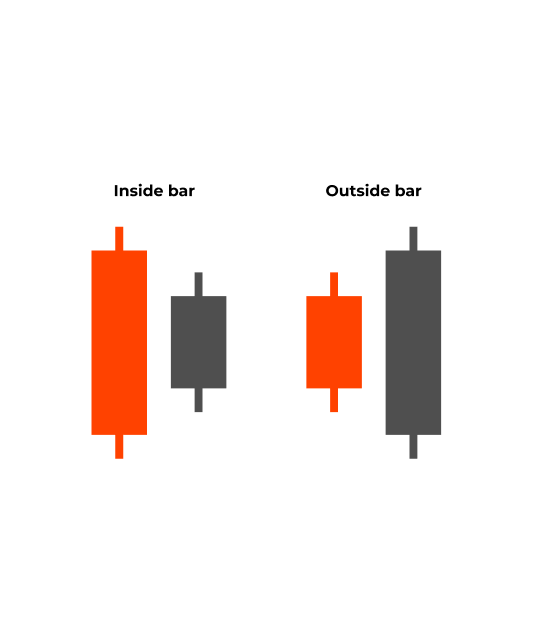
Inside and Outside Bars
An inside bar and an outside bar are two simple chart patterns that traders use to identify a possible short-term change in direction, along with potential breakout points. Typically, inside and outside bar patterns are identified using daily or weekly OHLC or candlestick bars.
- An inside bar occurs when the high and low of the current bar are completely engulfed by the high and low range, represented by the wicks, of the previous bar.
- An outside bar occurs when the high and low of the current bar are completely engulfing the high and low rang, represented by the wicks, of the previous bar.
Generally, the high and low of the engulfing bar will act as breakout levels for both patterns. Traders will often use these patterns in conjunction with other chart patterns and technical indicators to help identify trading setups and triggers.
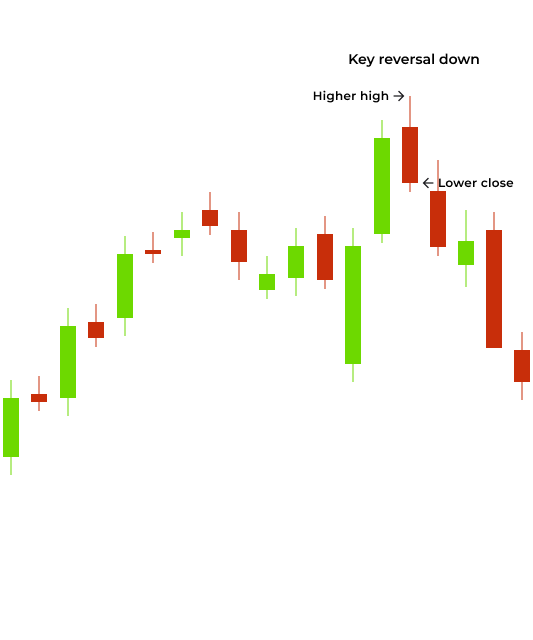
Key Reversals
A key reversal is a simple two-bar pattern that can help detect a short-term change in the market price trend direction. The pattern forms after an observable downtrend or uptrend. Key reversals are frequently used on daily price charts to help identify short-term swing trading opportunities that last a few days.
Key reversal up pattern: starts in a downtrend, then the key reversal bar (current bar) makes a significant low that is lower than the previous few bars, and then that same low bar closes higher than the close of the previous bar. This can often create an outside engulfing bar.
Key reversal down pattern: starts in an uptrend, then the key reversal bar (current bar) makes a significant high that is higher than the previous few bars, and then that same high bar closes lower than the close of the previous bar.
Generally, the strongest key reversal patterns occur at the top of an uptrend or at the bottom of a downtrend, increasing the probability and potential for prices to follow through in the direction of the pattern.
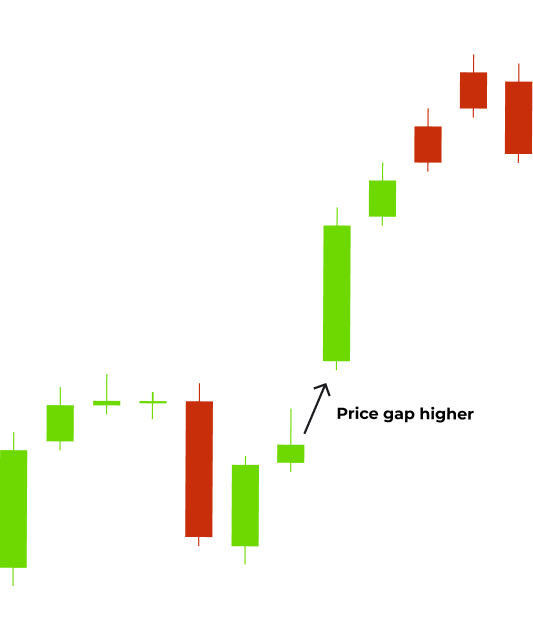
Opening Gaps
While the nearly 24-hour trading available in the futures markets has reduced the number of daily opening gap opportunities, there are still gaps to be found over the weekend and within certain commodity markets with more limited trading hours.
Gaps can easily be seen on a chart where the opening price jumps significantly up or down from the previous closing session. This generally occurs when there is an order imbalance at the open of the session, often caused by news, high volume, or high volatility after the close of the previous session.
There are two common ways traders look for opportunities in opening gaps:
- The exhaustion gap: where the price gap expends most or all of the built up buying or selling pressure, and then market price action reverses back to the previous bar. This is called "filling the gap".
- Continuation or breakaway gap: when market prices continue in the same direction as the opening gap. When a market has consolidated for one or more days, and there is a buildup of buying or selling pressure at a certain price level, that pressure can create a breakaway gap.

Technical Analysis Made Easy
Build your futures trading foundation using technical analysis to identify trends, support and resistance, and key chart patterns.
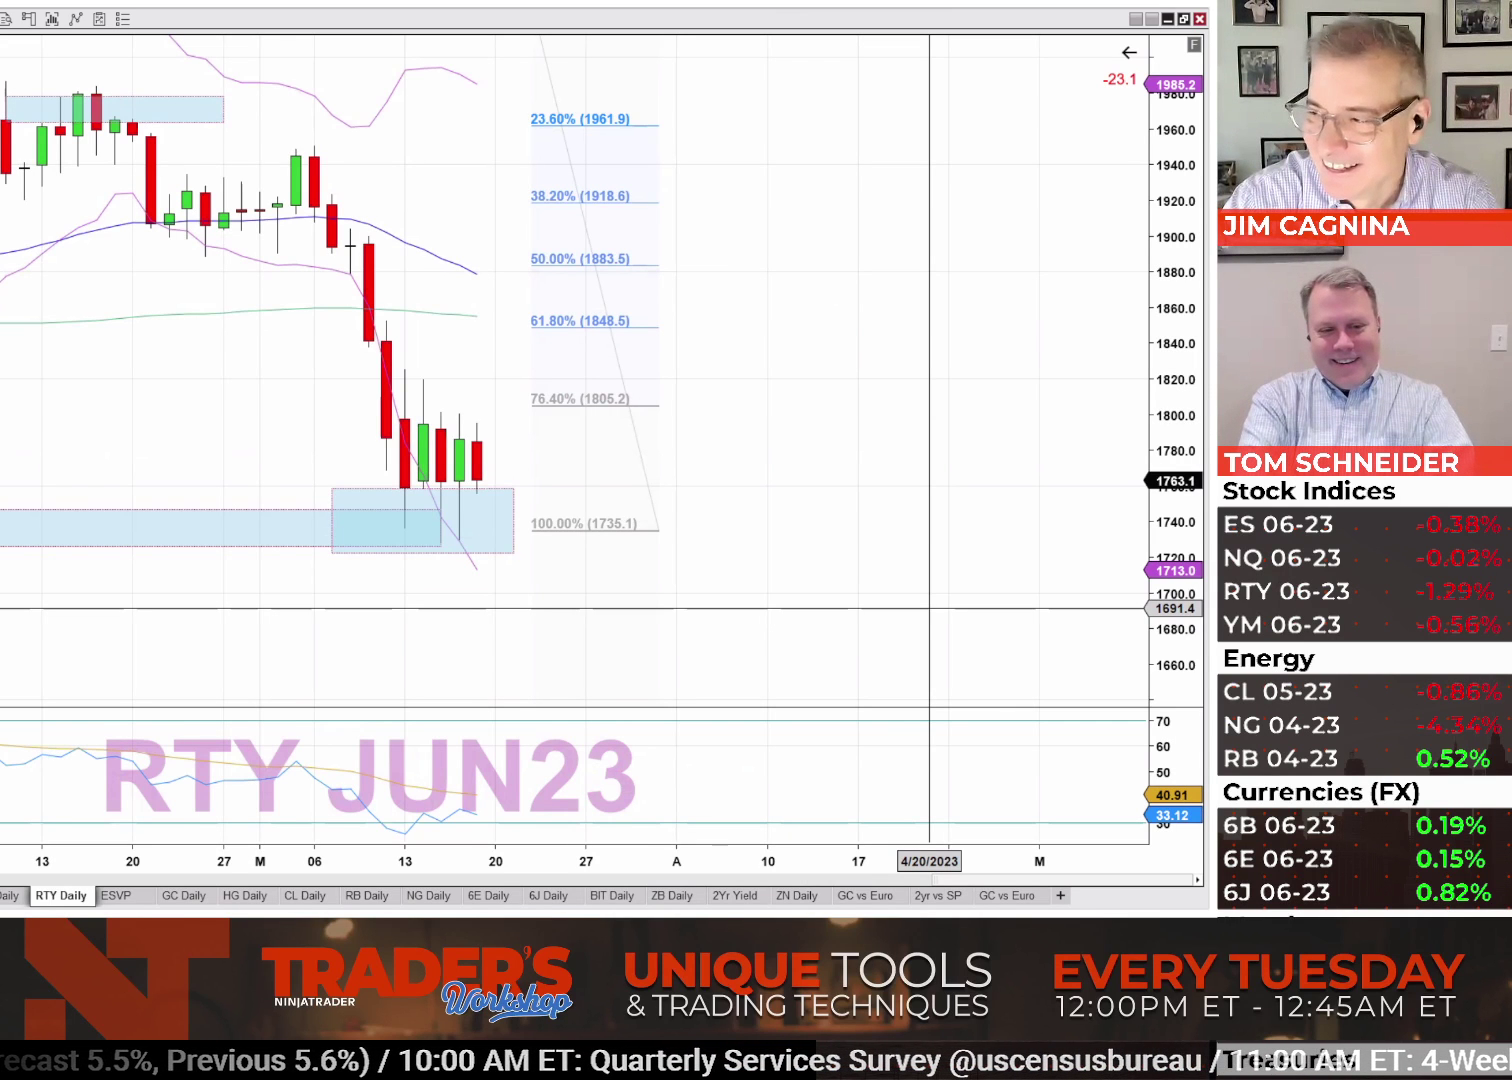
Learn How to Trade Futures with Pros at NinjaTrader
Join our free livestreams as we prepare, analyze and target live futures trade setups in real time.
Watch our industry pros trade the futures market open every weekday at 9:15am ET and the market close at 3:00pm ET using NinjaTrader’s award-winning charting and analysis tools.
Identify Chart Patterns on NinjaTrader’s Award-Winning Charts
Recognizing chart patterns that represent potential market behavior is a key first step in technical analysis for futures traders. Combining this knowledge with other indicators that measure momentum, volatility, and volume can help further visualize the markets and identify trading opportunities.
Get started with NinjaTrader’s award-winning trading platforms and simulated trading powered by real-time futures market data. Practice chart building, explore the available technical analysis tools and trade risk-free in simulation until you are ready for the live markets.