|
NinjaTrader supports a large variety of chart bar Types. This page explains how each bar type is created in a chart. Please see the Working with Price Data page for information on how to change bar Types.
Note: The last bar of a session may be built as an incomplete bar due to the session ending before the bar could be completed. Each new session will have bars freshly built beginning from the first tick of the session. For example, the last bar of a session in a 10,000 Volume chart may contain a volume less than 10,000, while the next bar which builds on a new session would contain 10,000 volume. This is to ensure that your charts are accurate and consistent regardless of how many historical dates you decide to load. Otherwise depending on when exactly the chart begins, the bars may look different since each session is impacted by all prior sessions.
When backtesting different bar Types (most notably Point and Figure) it can yield different results than what you would experience in real-time due to the nature of how the bars are constructed and simply not having enough granular information to simulate what would have happened in real-time. Please see the Discrepancies: Real-time vs Backtest page for more information.
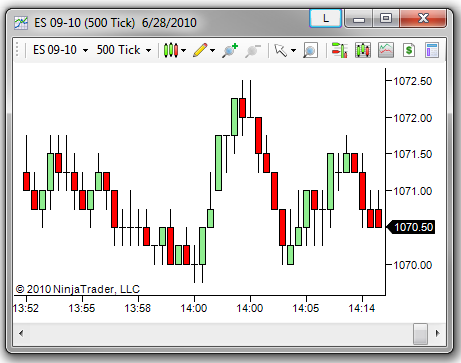
Tick Bars
A Tick bar is based on a specific number of trades (ticks). A bar will build until the specified number of ticks is reached. The next tick will then result in a new bar being created. For example, each historical bar in the the 500 Tick ES 09-10 chart shown below plots 500 ticks at a time.
|
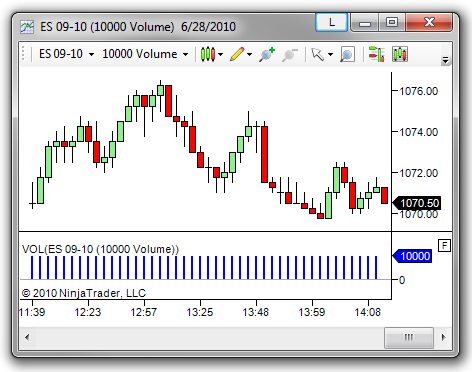
Volume Bars
A Volume bar is based on a specific number of units (volume) traded. A bar will build until the specified volume is reached and once surpassed, a new bar will be created. For example, each historical bar in the 10,000 Volume ES 09-10 chart shown below contains a volume of 10,000 contracts as verified by the "VOL" indicator plotted below the price bars.
|
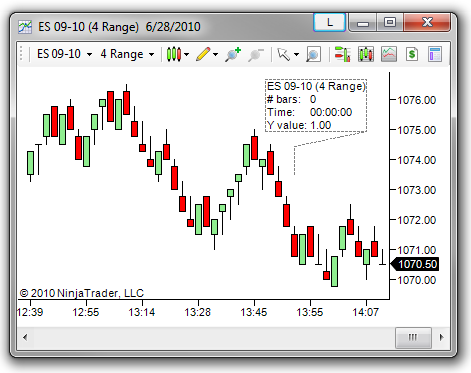
Range Bars
A Range bar is based on a specified tick* price range. The bar will plot until the price range is broken. A new bar will then start plotting. For example, each historical bar in the 4 Range ES 09-10 chart shown below is exactly 4 ticks (1 point) as measured from hight to low as displayed by the vertical line of the Ruler drawing tool. (The "Y value" of 1.00 shown in the Ruler's display box is equivalent to 4 ticks.)
*A tick in this instance is different from a tick in a Tick bar described in the sub-section above. A tick in a Tick bar represents when an actual trade occurred, whereas a tick in a Range bar is a price increment. This increment is the smallest price movement the instrument can make and may differ by instrument. For example, a tick on the e-mini S&P 500 (ES) is 0.25, while a tick on AAPL stock is 0.01. More information on setting the instruments Tick size can be found in the Editing Instruments section of the Help Guide.
|
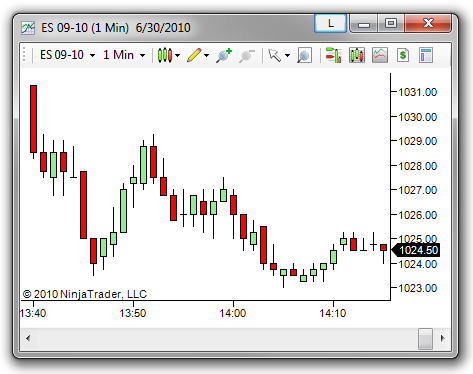
Time Bars
Second, Minute, Day, Week, Month, and Year bars are all built based on the passage of time. The bar will plot for a specified amount of time. Once this time is exceeded, a new bar will begin. For example, each historical bar in the 1 Min ES 09-10 chart shown below represents price movement for one minute in time.
|
Kagi Bars
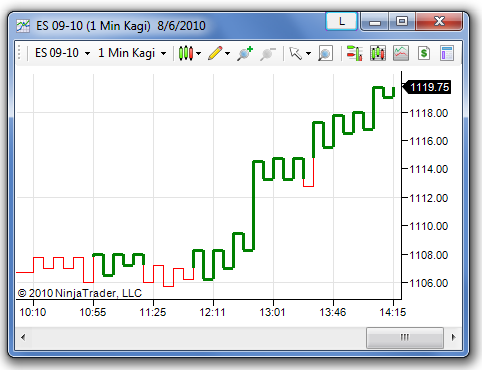
Kagi bars are built based solely on price movement with no regard to time or volume. A Kagi bar will plot in the direction of price until price reverses in a specified amount set as the Reversal. The bar will then change direction, but stay the same color until the last bar's high or low is surpassed. The length of time the bar will plot depends on the Base period.
For example, suppose the price of an instrument is heading down and the Reversal is set to 2 ticks. The line will continue to plot downward only until price reverses more than 2 ticks. At this point, the line will change direction, but stay red. Once the last Kagi bar high is exceeded, the line will change to a thick green color and the same rules will apply to the upside. The chart below displays 1 Min Kagi bars with a Reversal set to 2 ticks.
|
Renko Bars
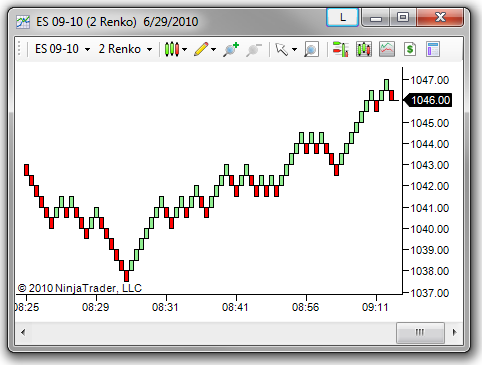
Renko bars are built based solely on price movement with no regard to time or volume. Each bar is known as a "brick" and a brick is plotted as green when price is moving up and red when price is moving down. A new brick is plotted when price exceeds the high or low of the previous brick by a specified amount set as the Brick size.
|
PointAndFigure Bars
PointAndFigure bars are built based solely on price movement with no regard to time or volume. Each bar is a column made up of only X's representing rising price or only O's representing decreasing price. Each X or O is referred to as a "box" and represents the price distance defined by the Box size (set in number of ticks). A new X or O box will be added to the bar when price moves more than the Box size to warrant adding another box.
Another setting called the Reversal sets the amount of price movement needed from the high/low to change from X's to O's or visa versa. A column will continue indefinitely until price reverses equal to the Reversal amount (set in number of boxes). There can never be two columns of X's or O's next to each other for a given session as any additional X's or O's would just be added to the current column. When a reversal occurs, the new column starts one box size above the last low for X's and one box size below the last high for O's.
For example, the chart below shows PointAndFigure bars based on a 1 Minute ES 09-10 Data Series. The Box size is set to 1 and the Reversal is set to 3. Starting from the left, price went from a low of 1042.75 to a high of 1046 without reversing 3 ticks. Since the Box size is set to 1 tick, anytime price goes higher than the last high by 1 tick, a new X is drawn at the top. (If the Box size was set to 2, an X would not be drawn until price exceeded the last X by 2 ticks.) Once it reversed 3 ticks, an O was drawn one box size below the last high of the X column at a price of 1045.75. Price then went down to 1044.25 without going up 3 ticks. Once it retraced 3 ticks an X was drawn one box size above the low of the previous O column. This same process is repeated resulting in the full PointAndFigure bar series.
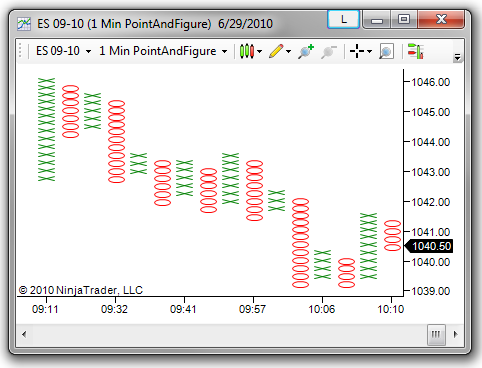
Note: The prices of the X's and O's are represented exactly in the middle of the X and O, not at the top or bottom of them.
|
LineBreak bars
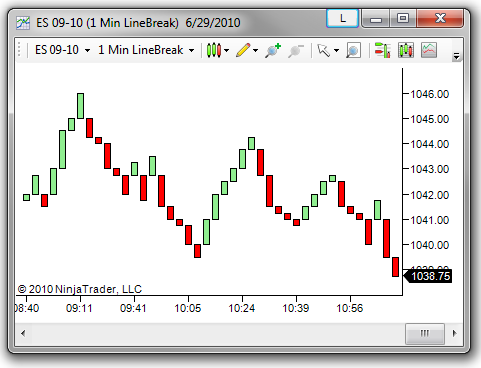
LineBreak bars are built based solely on price movement with no regard to time or volume. The Line Breaks parameter sets the number of previous bar's high or low that price must break to draw a new bar.
For example, if the Line Breaks parameter is set to 2 as shown in the chart below, the first bar is drawn based on whether the close was above or below the open. The second bar in the chart is drawn as green if price exceeds the first bar's high and red if price drops below the low of the first bar's low. No new bar is drawn if price does not exceed the high or low of the previous bar. The third bar is only plotted once price breaks the high/low of the last 2 bars since the LineBreaks parameter is set to 2. A color change occurs when price breaks the last 2 lows instead of highs or visa versa.
|
|


