Operations > Charts >

Working with Drawing Tools & Objects

Print this Topic Previous pageReturn to chapter overviewNext page

There are many customizable drawing tools and objects available to use in NinjaTrader charts.


tog_minusHow to draw on a chart

playVideo


Drawing on a Chart

Various drawing tools are available and customizable within a chart. The image below shows an example of several drawing tools applied to the chart.


Working_with_Drawing_Tools_1


Accessing  Drawing Objects

Drawing objects can be accessed in the following ways:


1.Right mouse click within the chart and select the Drawing Tools menu
2.Left mouse click on the Drawing Tools button in the toolbar at the top of the chart
3.Via Hot Key


Stay in Draw Mode

When "Stay in Draw Mode" is enabled from the Drawing Tools menu, drawing tools will stay selected and can be used to draw multiple times without having to access the Drawing Tools menu.


Ruler

The Ruler measures the number of bars, amount of time, and Y-axis distance between the first two Ruler anchor points for a Data Series. The measurement data is attached as a flag to a third, independent anchor point.


To use the Ruler:


1.Select the Ruler drawing object from the Drawing Tools menu
2.Select the Data Series or Indicator you wish to measure by left mouse clicking on it (you can skip this step if the series you wish to measure is the only series on the specific chart panel)
3.Left mouse click on the chart where you wish to place the first anchor point
4.Left mouse click a second time on the chart where you wish to place the second anchor point
5.Left mouse click a final time to set the anchor point for the Ruler display flag.


Working_with_Drawing_Tools_2


The anchor points can be relocated after setting by left mouse clicking on the anchor point and dragging to a new location.


Drawing Objects

The following are the available drawing objects with default Hot Keys found within the Drawing Tools menu:


Ruler

Ctrl + F3

Line

F2

Ray

F3

Extended Line

F4

Arrow Line

Ctrl+F2

Horizontal Line

F6

Vertical Line

F7

Fibonacci Retracements

F8

Fibonacci Extensions

F9

Fibonacci Time Extensions

F10

Fibonacci Circle

F11

Andrew's Pitchfork

Ctrl + F8

Gann Fan

Ctrl + F9

Regression Channel

Ctrl + F10

Trend Channel

Ctrl + 2

Ellipse

Ctrl + F11

Rectangle

Ctrl+ F12

Triangle

Ctrl + F6

Arc

Ctrl + F7

Text

F12

Chart Marker:

Arrow Up

Arrow Down

Diamond

Dot

Square

Triangle Up

Triangle Down


Alt+F2

Alt +F3

Alt +F5

Alt +F6

Alt +F7

Alt +F8

Alt +F9


Applying a Drawing Object to the Chart

To apply a drawing object to the chart:


1.Select the drawing object from the Drawing Tools menu. The cursor will change to resemble a pen. (Right clicking or pressing the "Esc" key will cancel the operation)
2.Left mouse click on the chart where you want the first anchor point set
3.Left mouse click again on the chart for any other necessary anchor points. Once all anchor points are set, the cursor will change back to the cursor type you had previously selected.

Once the drawing object is applied to the chart, it can be selected by left mouse clicking on it. Once selected, the object can be moved throughout the chart and the anchor points can be moved by left mouse clicking and dragging to a new location.


Working_with_Drawing_Tools_3

tog_minusUnderstanding snap mode

Snap Mode

Drawing objects can be attached to price and/or time data within the chart by using any of the Snap Mode options available in the Drawing Tools menu:


Disabled

Disables "Snap Mode" and allows the drawing object anchor point(s) to be placed anywhere on the chart

Bar

Sets the x-axis value of drawing object anchor point(s) to the bar interval values only

Price

Sets the y-axis value of drawing object anchor point(s) to the Data Series OHLC and indicator price values only

Bar and Price

Sets the x and y-axis of drawing object anchor point(s) to be aligned with bar interval values, Data Series OHLC  and indicator price values only

tog_minusUnderstanding drawing object properties

playVideo


Each drawing tool can be customized using the Drawing Object Properties menu.


Accessing the Drawing Object Properties

To access a drawing object properties:


1.Left mouse click on the drawing object to select it (once selected, the anchor points will be visible)
2.Either double left mouse click on the drawing object, or right mouse click and select the Properties... menu item


Drawing Object Properties Menu

Properties vary between drawing objects. There are common properties as shown in the Line Properties image below and specific properties depending on the drawing object.


The general properties of the drawing object are located in the General tab. The image below shows the General tab properties for the Line drawing object.


Color

Sets the color of the drawing object

Width

Sets the width of the drawing object

Dash Style

Sets the drawing object dash style

Attach to

Applies the drawing object to the selected instrument on a single chart or all charts with the same instrument. (see the "How to Enable a Global Drawing Object" section below)

Lock

Locks the drawing object on the chart which makes it immovable.

Auto Scale

Adds the drawing object to the auto-scaling in the chart.


Working_with_Drawing_Tools_4


The Data tab displays the data locations of the drawing object anchor points in the chart. These fields can be modified to change the location of the drawing object within the chart.


Tag

The Tag property is a naming convention used to access the drawing object via NinjaScript. Any Tag values generated via NinjaScript are grayed out and cannot be changed. Each drawing object must have a unique Tag value.

Start Time

Sets the x-axis start value of the drawing object

Start Y

Sets the y-axis start value of the drawing object

End Time

Sets the x-axis end value of the drawing object

End Y

Sets the y-axis end value of the drawing object


Working_with_Drawing_Tools_5


Drawing object properties can be saved as default using the Set Default button. Please see the "Saving Chart Defaults" section of the Help Guide for more information.

tog_minusHow to remove drawing objects

playVideo


Removing Drawing Objects

To remove a single drawing object:


1.Left mouse click on the drawing object to select it (when selected, the anchor points will appear)
2.Press the Delete key on the keyboard or right mouse click on the drawing object and select the Remove menu item


To remove multiple drawing objects at the same time:


1.Select the Drawing Tools menu via right mouse clicking in chart or via left mouse clicking the Drawing Tools icon in the chart toolbar
2.Left mouse click on the Remove Drawing Objects menu item
3.The Remove Drawing Objects window will appear (image below).
4.Select either the group of drawing objects you wish to remove, or choose the "Select All" option and press the OK button to remove the selected drawing objects from the chart.


Working_with_Drawing_Tools_6


Removing a global drawing object will remove the object from all charts.

tog_minusUnderstanding Fibonacci drawing object templates

playVideo


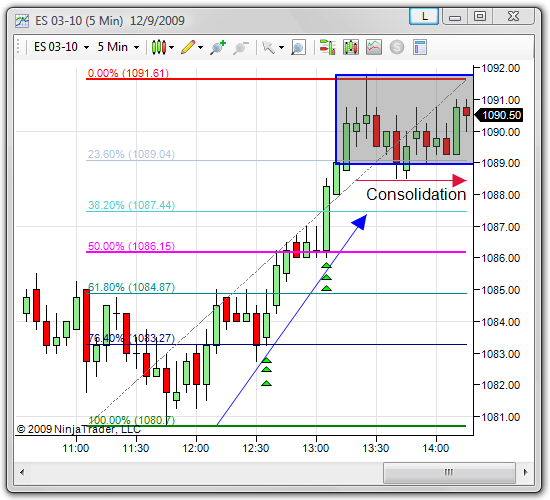
The properties for all Fibonacci drawing objects can be saved within templates. This allows multiple property setups to be saved and applied to any Fibonacci drawing object on a chart.


How to Save Fibonacci Templates

To save Fibonacci properties as a template:
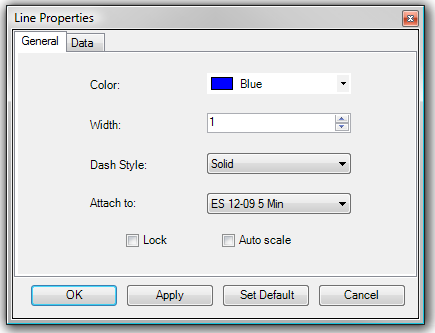
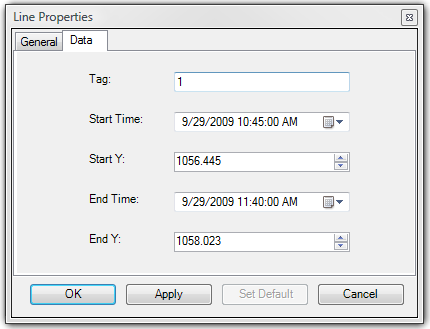
 

1.Open the Fibonacci drawing object Properties window (See the "Understanding drawing object properties" section above)
2.Configure properties within the General tab to the desired settings
3.Right click within the Fibonacci drawing object Properties window and select the menu item Manage Templates.
4.Enter a name for the template and press the Save button.


Note: Saving a new Fibonacci template as "Default" will make it the new default template.


(Press the Remove button to delete the selected template)


Once a template is saved, it can be applied to any Fibonacci drawing object on the chart by selecting the template name from the Template drop down menu found in the Fibonacci drawing object properties window.

tog_minusUnderstanding local vs. global drawing objects

playVideo


Drawing objects can be applied to a specific chart (local), or to all charts of the same instrument (global). You can optionally exclude any Data Series to NOT display a global draw object by setting the property "Show global draw objects" to false in the Format Data Series window.


How to Enable a Global Drawing Object

To enable a global drawing object:


1.Apply a drawing object to the chart (see the "How to draw on chart" section above)
2.Access the drawing object's properties (see the "Understanding drawing object properties" section above)
3.Locate the "Attach to" drop down menu and select "Instrument name" (All charts)


The drawing object will now be applied to all charts for that specific instrument as well as any new charts opened for that instrument. Global drawing objects are stored even when a chart of the instrument is not open


Global drawing objects will be automatically deleted after 20 days of not being viewed. This is done to conserve PC resources.