|
NinjaTrader comes with over 100 pre-built indicators. Indicators can be added, removed and edited via the Indicators window.

The Indicators window is used to add, remove and edit all indicators within a chart.
Accessing the Indicators Window
There are multiple ways to access the Indicators window:
| • | Left click on the indicator icon in the chart toolbar |
| • | Right mouse click in the chart background when no chart object is selected and select the menu |
| • | Double click on an indicator within a chart |
| • | Right click on a highlighted indicator within a chart and select the menu |
| • | Use the default CTRL + I Hot Key when the chart has focus. |
Sections of the Indicators Window
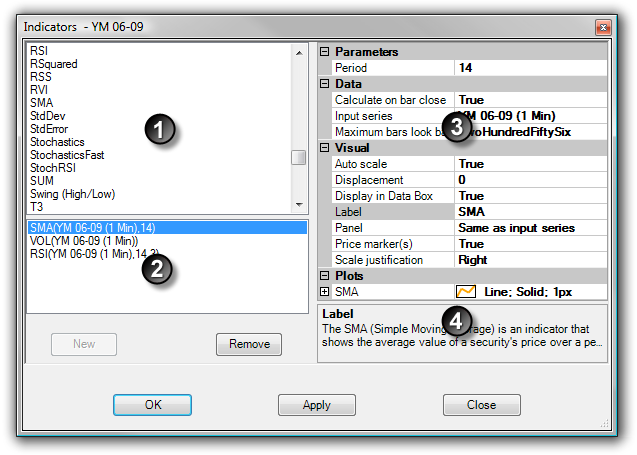
The image below displays the four sections of the Indicators window.
| 1. | List of available indicators |
| 2. | Current indicators applied to the chart |
| 3. | Selected indicator's parameters |
| 4. | Selected indicator or parameter's description |
|
Adding an Indicator
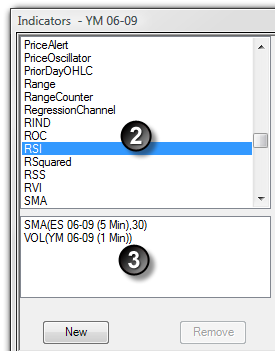
To add an indicator to a chart:
| 1. | Open the Indicators window (see the "Understanding the Indicators window" section above) |
| 2. | Left mouse click on the indicator you want to add and press the New button or simply double click on it |
| 3. | The indicator will now be visible in the list of applied indicators |
| 4. | The indicator's parameters will now be editable on the right side of the Indicators window (see the "How to edit an indicator" section below) |
|
Editing an Indicator
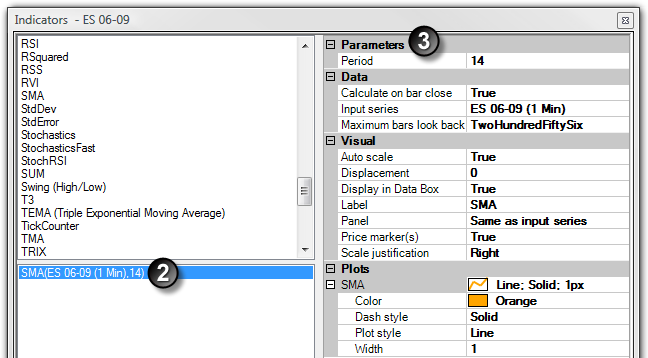
You can customize any indicator from the Indicators window.
| 1. | Open the Indicators window (see the "Understanding the Indicators window" section above) |
| 2. | Highlight the indicator you would like to edit from the list of applied indicators (as shown in the image below). |
| 3. | Once highlighted this indicator's parameters will be available to edit on the right hand side. |
|
Indicator Parameters
The following parameters are common to all indicators:
Calculate on bar close
|
If true, will only calculate the indicator's value on the close of a bar. If false, NinjaTrader will calculate the indicator's value with each incoming tick
|
Input Series
|
Please see the Input series section for further information.
|
Maximum bars look back
|
Max number of bars used for calculating an indicator's value. The TwoHundredFiftySix setting is the most memory friendly.
|
Auto Scale
|
If true, the indicator is part of the chart panel's vertical automatic scaling
|
Displacement
|
Displaces the plot back by this value (value of 2 would plot the current indicator value two bars ago)
|
Display in Data Box
|
If true, will display the indicator values in the chart Data Box
|
Label
|
The label displayed on the chart. Leaving the field blank will remove the label from being displayed on the chart. Enclosing a label in quotations ("MyEMA" for example) will display what's within the quotations and exclude the system added trailing series information.
|
Panel
|
The panel the indicator is plotted on. If you select the indicator will be linked to the input series and automatically move with the input series if it is modified to a different panel.
|
Price marker(s)
|
If true, the indicator value is plotted in the axis selected under the Scale justification parameter.
|
Scale justification
|
Sets the scale axis the indicator will be plotted on within its selected panel. Please see the Navigating a chart user help guide section for additional information.
|
Lines
|
Allows you to customize the appearance of editable lines that are plotted by the indicator.
|
Plots
|
Allows you to customize the appearance of the indicator by changing: the Color, Dash style, Plot style, and Width.
|
Saving an Indicator's Parameters as Default
You can optionally save your customized indicator's parameters as default. Doing so will recall your customized settings the next time you add this specific indicator to a chart.
Please see the Saving Chart Defaults section of the Help Guide for more information.
|
Indicator Input Series
The indicator Input Series window (image right) allows you to select the input series for your indicator's calculations. To access this window left mouse click on the "..." button within the Input series parameter. You can then select the Close, High, Low, Median, Open, Typical, or Weighted value of any Data Series within a chart. Additionally, you can also choose another indicator as the input series. When you select another indicator as the input series, another Input Series window will appear where you can define the input series for the second indicator. This allows you to nest multiple indicators. Once you have selected the input series of your choice left mouse click the OK button to exit the Input Series window.
|
Removing an Indicator
There are three ways to remove an indicator from your NinjaTrader chart:
| • | Open the Indicators window (see the "Understanding the Indicators window" section above), select an indicator from the applied indicators list, press the Remove button, and then press the OK button to exit the Indicators window. |
| • | Left mouse click to select the indicator on your chart and then press the Delete button on your keyboard. |
| • | Left mouse click to select the indicator on your chart, then right mouse click and select the menu to remove the indicator from your chart. |
|
In addition to the over 100 indicators that come pre-built with the NinjaTrader application, you also have the ability to create custom indicators of your own. For example, you could create your own custom multi-series indicators to apply to your NinjaTrader charts.
For more information on using NinjaScript to build custom indicators please see the NinjaScript section of the user help guide. Click here to view NinjaScript tutorials.
The option to hire a NinjaScript Consultant to build your custom indicators is also available.
|
|


