|
The following section covers navigation and display of NinjaTrader charts.

Horizontal Scrolling (panning chart left or right)
You can pan the chart left or right via the following controls:
| • | Horizontal chart scroll bar at bottom of chart |
| • | Left mouse click and hold on chart canvas and drag left or right |
| • | CTRL key + Left mouse click and hold in the x-axis (time axis) and drag left or right |
| • | Mouse scroll wheel scrolls the chart back and forth along the x-axis 3 bars at a time |
| • | CTRL key + mouse scroll wheel scrolls the chart back and forth 9 bars at a time |
| • | Left arrow key scrolls the chart back one bar at a time |
| • | Right arrow key scrolls the chart forward one bar at a time |
| • | Page Up scrolls the chart back one page at a time |
| • | Page Down scrolls the chart forward one page at a time |
| • | Home key scrolls the chart to the very beginning |
| • | End key scrolls the chart to the very end |
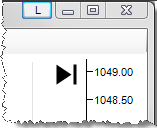
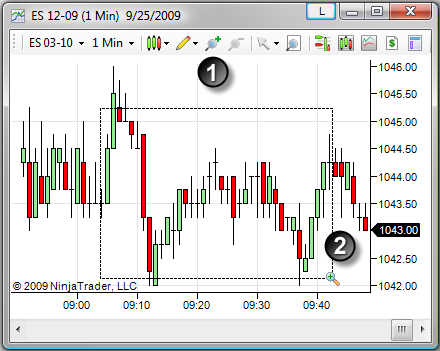
Out of Range Icon
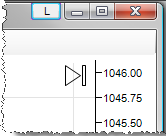
If the horizontal axis is scrolled to the left or right from its starting location, a "return" icon will appear in the top right hand corner of the chart. Left mouse click on the icon to return the horizontal axis to its original position before scrolling occurred.
A solid "return" icon means the last visible bar is to the right of the viewable area
|
A hollow "return" icon means the chart is horizontally scrolled to the left
|
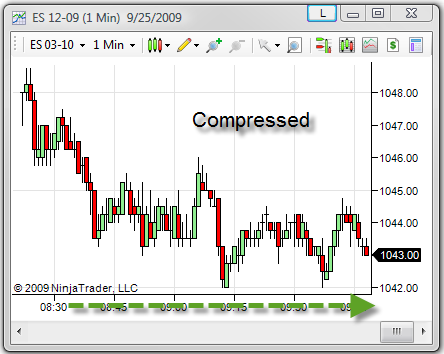
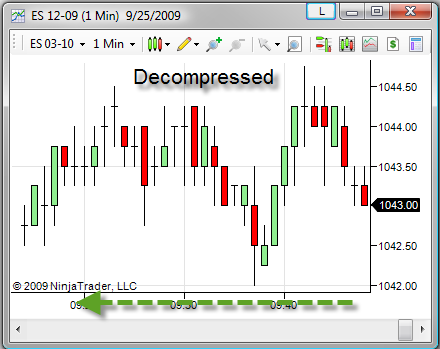
Horizontal Scaling
To compress or decompress the horizontal axis, left mouse click in the x- axis margin and move the mouse cursor to the left or right. Alternatively, use the Hot Keys CTRL + Up and CTRL + Down.
|
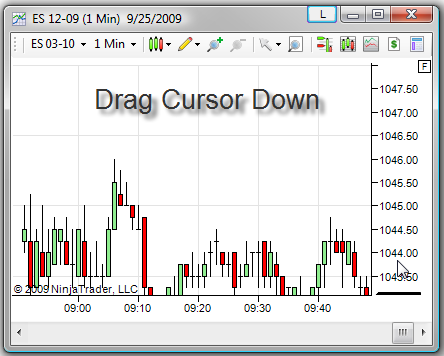
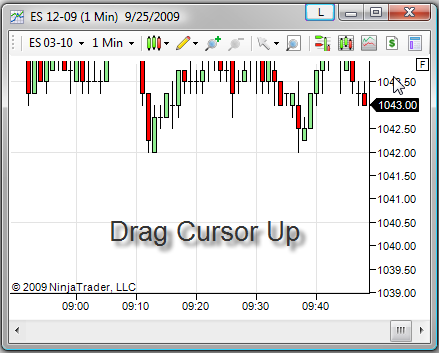
Vertical Scrolling (panning chart up or down)
To pan the chart up or down:
CTRL + Left mouse click and hold on chart margin and drag up or down as depicted in the images below:
A box with an "F" (Fixed) will appear in the upper right corner of the chart margin anytime the vertical chart axis is manually adjusted. This signifies the chart axis is set to a "fixed" scale. Left mouse click this button to return to auto scale.
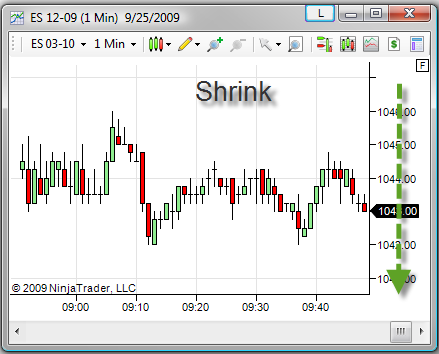
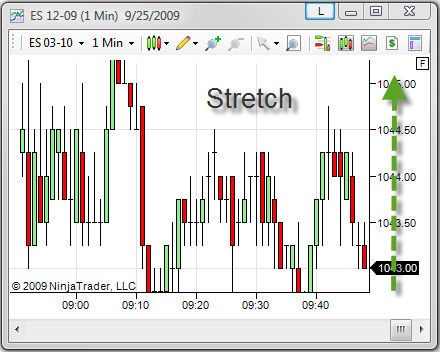
Vertical Scaling
There are two methods to shrink or grow the vertical axis of the chart:
| 1. | Double click in the right or left margin to open the Chart Panel Properties window, or right mouse click in the price scale and select the menu Properties... Set the Range to Fixed and enter a Maximum and Minimum for the chart scale. |
| 2. | Left mouse click in the y-axis margin and move the mouse cursor up or down as shown in the images below: |
|
Zoom In
To create a zoom frame around a chart area you want to focus in on:
| 1. | Left mouse click on the Zoom In icon in the tool bar, select the menu item within the right mouse button click context menu, or use the zoom in Hot Key CTRL+Z |
| 2. | Left mouse click and while holding down the left mouse button, draw a zoom frame region and release the button. |
The chart display area will zoom in to the selected frame area.
Zoom Out
Each zoom in can be undone to the prior zoom level with a zoom out. To zoom out, left mouse click on the Zoom Out icon in the chart tool bar, select the menu item within the right mouse button click context menu, or use the zoom out Hot Key CTRL+O.
|
|
Before changing bar spacing or width, you must select the Data Series you want to adjust by left mouse clicking on it. If none is selected, the primary Data Series of the chart will be adjusted.
Bar Spacing
To change the spacing between bars:
| • | CTRL + Up arrow key decreases bar spacing |
| • | CTRL + Down arrow key increases bar spacing |
Bar Width
To change the width of bars:
| • | ALT + Up arrow key decreases bar width |
| • | ALT + Down arrow key increases bar width |
Alternatively, left mouse click on the "Bar style" chart toolbar icon to access bar spacing and width functions
|
Panels
A chart is comprised of Panels that contain chart objects such as Data Series, Indicators and Drawing Objects. Panels are added to a chart during the process of adding/editing a Data Series or Indicator. Every Panel has three independent scales to which you can associate a chart object to. Each scale can be uniquely customized via the panel properties (see "Panel Properties" sub-section below for more information):
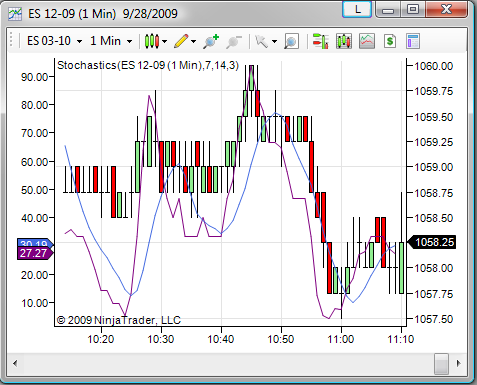
Panel Scales
When adding a Data Series or Indicator to a chart, you can set the Scale justification property to align the chart object to any of the following scales within the Panel:
With the exception of the Overlay scale, a price scale will only be displayed in a Panel if there is one or more chart objects justified to it. The Overlay scale does not have a visible price scale however, any chart objects justified to this scale will display their price markers first on the Right scale if one exists otherwise they are displayed on the Left scale. All scales can be shared by multiple chart objects.
In addition to changing a chart objects scale justification property via the Data Series window or Indicators window, you can drag and drop a chart object onto different scales. Please see the sub-section ("How to drag and drop chart objects") lower down within this topic page.
|
The image above depicts the ES 12-09 futures contract justified to the Right scale and a Stochastics indicator justified to the Left scale within the same Panel.
|
Panel Context Menu
Right mouse click within the price scale to access the panel context menu. The following actions are available:
Move Up
|
Moves the panel up by one
|
Move Down
|
Moves the panel down by one
|
Maximize
|
Maximizes the panel (an "M" along with left and right arrows will appear in the lower right of the chart. Clicking the "M" will restore the panel and using the arrow buttons will toggle the maximized window between Data Series)
|
Restore
|
Restores the maximized window to the original size
|
Arrange All
|
Arranges all panels to default proportions
|
Remove
|
Deletes the panel from the chart
|
Properties
|
Opens the panel properties window
|
Panel Properties
The menu can be opened by double left mouse clicking within the price scale or selecting the menu via the menu discussed above. The Panel Properties window will list the properties below grouped by each scale that is currently active on the Panel.
The following properties can be adjusted:
Range
|
Sets the range to "Automatic" or "Fixed." Fixed allows the manual setting of the upper and lower boundary of the chart. The range can also be manually defined via the mouse. Please see the section above "How to change the vertical scale and range of a chart".
|
Based on
|
Sets a value indicating how the automatic scale range is calculated. When set to “EntireDateRangeSeriesOnly”, Data Series and Indicator values for the entire date range of the chart (draw objects are ignored) are used to calculate the vertical scale range. When set to “ScreenDateRange”, all visible objects on the screen are used.
|
Horizontal grid lines interval type
|
Sets a value of either "Ticks" or "Points" which is used to calculate the interval between grid lines and labels
|
Horizontal grid lines interval value
|
Sets the vertical interval of the horizontal axis. A value of 0 (zero) will enable the automatic generation of grid line intervals. The Right scale will always take precedence over the left scale if both are set to user defined custom grid line intervals.
|
Margin type
|
Sets the calculation mode for determining the upper and lower panel margins. ("Percent" values are whole percents. For example, entering a value of "1" equals 1%.)
|
Margin lower
|
Sets the lower margin value
|
Margin upper
|
Sets the upper margin value
|
Maximum
|
Sets the scale's upper boundary when using "Fixed" range
|
Minimum
|
Sets the scale's lower boundary when using "Fixed" range
|
Type
|
Sets the scaling type to "Linear" or "Logarithmic"
|
|
Drag and Drop
A Data Series or Indicator can be dragged and dropped to various areas of the chart to quickly change which panel it is displayed in.
Left mouse click on a chart object within a chart and drag and drop to any of the following areas of the chart:
| 1. | Upper limit - Creates a new panel at the top of the chart |
| 2. | In between panels - Creates a new panel in between two existing panels |
| 3. | Lower limit - Creates a new panel at the bottom of the chart |
| 4. | Center area of a panel - Relocates the selected chart object to this panel and automatically determines the most suitable scale justification |
| 5. | Left or right area of a panel - Relocates the selected chart object to this panel (unless already in the selected panel) and changes the scale justification to the selected side of the panel. |
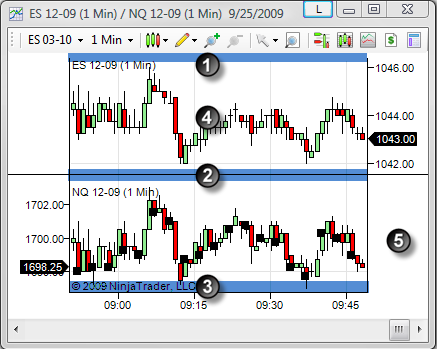
When you drag a selected object to a valid region on the chart, a blue band will appear acknowledging you that by dropping the object at this particular location, a new panel will be created.
|
|
Z-Order
Objects within a panel can be adjusted by paint order to appear behind or in front of another chart object.
You can change the z-order (paint order) of all chart objects within each individual panel. Each chart object is assigned a level value which informs you where in the paint order the particular object resides. As a rule of thumb, there are as many levels on a panel as there are chart objects on it. For example, if you had a Data Series and a simple moving average indicator on a panel, there would be two painting levels. Level 1 is the top most level which means that any chart object on Level 1 would be painted above all others. Continuing our example, if the Data Series was on Level 1 of 2 and the simple moving average was on Level 2 of 2, that would mean the Data Series would be painted on top of the Data Series.
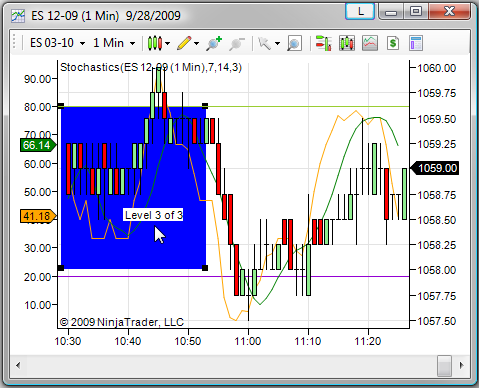
The image below depicts a "Rectangle" drawing object set at z-order Level 3 of 3, which is behind both the Stochastics indicator (Level 2 of 3) and the ES 12-09 Data Series (Level 1 of 3).
|
To adjust the z-order:
| 1. | Select the chart object by left mouse clicking on it |
| 2. | Hold down the "Shift" key on your keyboard and roll the mouse scroll wheel to change the z-order of the object. The current position out of the total number of levels in the z-scale will be displayed. |
Note: Draw objects originating from a NinjaScript indicator or strategy will all generally share the same z-order as the script. To have the objects on a separate z-order would have to be set programmatically.
|
Cursor Type
You can have either the standard windows pointer, cross hair or Global Cross Hair for chart navigation. You can toggle between cursor modes via the right mouse click context menu cursor sub menu, the "Cursor" chart toolbar icon or via the following shortcut keys:
CTRL + R
|
Pointer
|
CTRL + Q
|
Cross Hair
|
CTRL + G
|
Global Cross Hair (links crosshairs when enabled on two or more charts)
|
|
|