|
Data Series are added, edited, and removed via the Data Series window.

The Data Series window is used to configure the Data Series within the chart, edit Data Series parameters, and save default values for the Period Type.
Accessing the Data Series Window
There are multiple ways to access the Data Series window:
| • | Select the menu from the NinjaTrader Control Center, left mouse click the menu item and select the menu item ... |
| • | Right mouse click in the chart background and select the menu ... |
| • | Use the default CTRL+F Hot Key from an open chart |
| • | Double left mouse click on a Data Series within the chart |
| • | Right mouse click on a selected Data Series within a chart and select the menu |
Sections of the Data Series Window
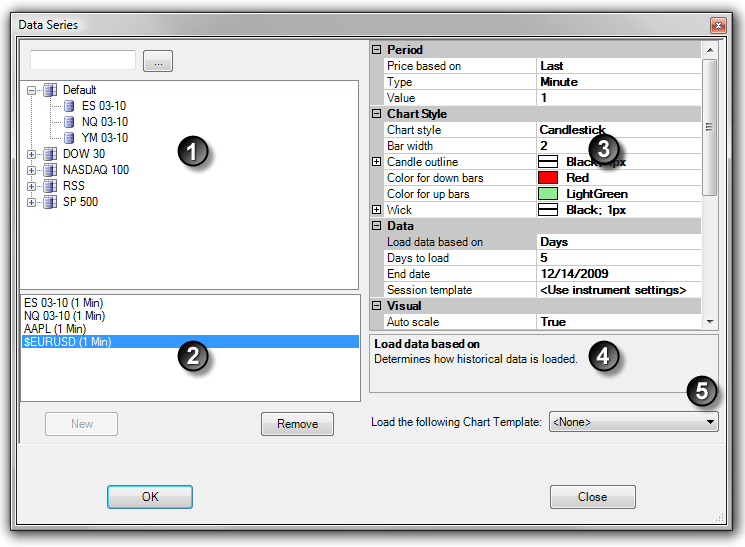
The image below displays the five sections of the Data Series window.
| 1. | List of instruments that can be added as Data Series objects |
| 2. | Current Data Series objects applied to the chart |
| 3. | Selected Data Series object's parameters |
| 4. | Selected parameter's description |
| 5. | Saved Chart Templates that can be applied to the new chart. See the "Chart Templates" section of the Help Guide for more information. |
|
Adding a Data Series
Multiple Data Series objects can be applied within a chart and a new panel is automatically created for each Data Series added unless specified to an existing panel. There are multiple ways to add a Data Series to a chart using the Data Series window:
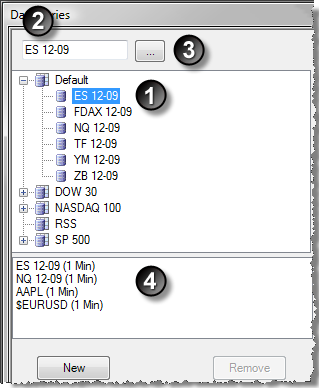
| 1. | Left mouse click on the instrument you want to add as a Data Series and press the New button or simply double left mouse click on it |
| 2. | Type the instrument symbol, including front month for futures instruments, in the empty search field above the Data Series list and press the "Enter" key. For example, "ES 12-09" |
| 3. | Left mouse click on the "..." button next to the search field. The Instrument Lookup window appears. Use the name or description field to search available instruments and double left mouse click on the desired instrument. (See "Instrument Lookup Window" topic below.) |
The added Data Series will now be visible in the list of applied Data Series objects. (4)
A Data Series can also be added by typing directly into an open chart. Type the plus symbol (+) followed by the instrument symbol, front month for Futures, and appropriate interval value. Typing "+ES 12-09 5M" will add a 5 minute ES 12-09 Data Series to the selected chart. (See the "How to change a Data Series" section below for more information)
The Data Series parameters will now be editable on the right side of the Data Series window when you have an applied Data Series selected. (see the "How to edit Data Series parameters" sub-section below)
Instrument Lookup Window
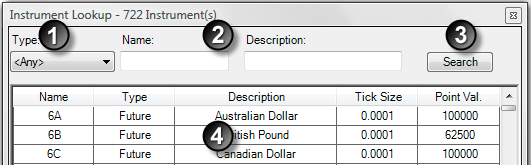
To search for an instrument using the Instrument Lookup window:
| 1. | Select the Type for the instrument |
| 2. | Enter text in the Name or Description field |
| 3. | Left mouse click the Search button. Instruments satisfying the search criteria are listed. |
| 4. | Once you have located the instrument, double left mouse click and press the "Enter" key to add the instrument as a Data Series. |
|
Editing a Data Series
Data Series parameters are available for configuration within the Data Series window once it is added to the chart (see the "How to add a Data Series" section above).
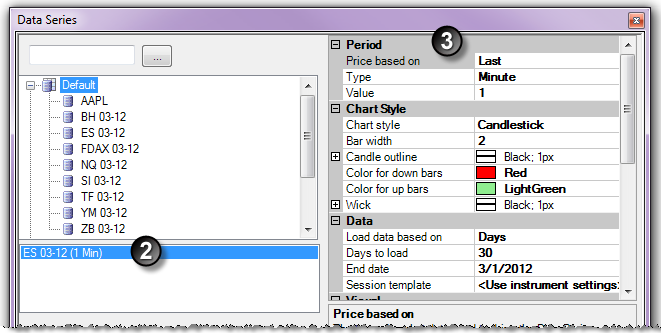
To edit Data Series parameters:
| 1. | Open the Data Series window (see the "Understanding the Data Series window" section above) |
| 2. | Select the Data Series you would like to edit in the list of applied Data Series (as shown in the image below). |
| 3. | Once selected, the Data Series parameters will be available to edit on the right hand side. |
The section of the Data Series window below the parameters will display a description of the selected parameter. Left mouse click in a parameter row to edit the property. Select an option from the drop down menu or if one does not appear, type in the desired value.
|
Data Series Parameters
Price based on
|
Sets the type of market data used to drive the Data Series.
|
Type
|
Sets the bar type of the Data Series. See the Bar Types section of the Help Guide for more information.
|
Value
|
Sets the Data Series value.
|
Base period type
|
Sets the underlying Data Series type used. (Kagi, PointAndFigure, and LineBreak only)
|
Base period value
|
Sets the underlying Data Series value used. (Kagi, PointAndFigure, and LineBreak only)
|
Reversal
|
Sets the reversal value. (Kagi and PointAndFigure only)
|
Reversal type
|
Sets the type of reversal calculation used. (Kagi only)
|
Brick size
|
Sets the brick size value. (Renko only)
|
Box size
|
Sets the box size value. (PointAndFigure only)
|
Price
|
Sets the price type used for Data Series calculations. (PointAndFigure only)
|
Line Breaks
|
Sets the number of lines used to determine a line break. (LineBreak only)
|
Chart style
|
Sets the style of the bars.
|
Bar width
|
Sets the width of the bar.
|
Candle outline
|
Sets the visual properties of the candle outline.
|
Color for down bars
|
Sets the color for the down bars.
|
Color for up bars
|
Sets the color for the up bars.
|
Load data based on
|
Determines how much data is loaded based on number of bars, number of days, or a custom date range.
|
Days to load
|
Sets the number of days to load data.
|
Start date
|
Sets the start date of the chart. *If the specified start date is within a session (part of a Session Template definition) whose start time falls on a prior date then the Chart will start on that prior date.
|
End date
|
Sets the end date of the chart. *If the specified end date is within a session (part of a Session Template definition) whose end time falls on a future date then the Chart will end on that future date.
|
Session template
|
Sets the session time template for the Data Series. (See the "Session Manager" section of the Help Guide for more information)
|
Auto scale
|
When true, the Data Series is part of the chart auto scaling
|
Display in Data Box
|
When true, the Data Series values will display in the chart Data Box.
|
Label
|
Sets the label display text of the chart window (can be left blank to remove label)
|
Panel
|
Sets the panel the Data Series is displayed on.
|
Plot session break line
|
When true, will plot the session break line in the chart.
|
Price marker
|
When true, the Data Series value will plot in the Y-axis.
|
Price marker color
|
Sets the color of the price marker.
|
Scale justification
|
Sets the scale the Data Series will be displayed on.
|
Session break line
|
Sets the visual properties of the session break line.
|
Show global draw objects
|
Enables or disables a global drawing object to be shown in this chart. (See the "Understanding local vs. global drawing objects" section of the Working with Drawing Tools & Objects section of the Help Guide for more information.
|
Color for executions - buy
|
Sets the color of the plotted buy executions.
|
Color for executions - sell
|
Sets the color of the plotted sell executions.
|
NinjaScript strategy profitable trade
|
Sets the visual properties of profitable strategy position lines.
|
NinjaScript strategy unprofitable trade
|
Sets the visual properties of the unprofitable strategy position lines.
|
Plot executions
|
Sets the plotting style of the trade executions.
Note: Real-time executions are timestamped with your local PC clock when they are placed. Should your PC clock be out of sync with the timestamps of the Bars on the chart the executions may appear to show up on the wrong bar. Please see the How Trade Executions are Plotted article for more information.
|
Saving a Data Series Type Parameters as Defaults
You can optionally save your customized Data Series Type parameters as default. Doing so will recall your customized settings the next time you add this specific Data Series Type to a chart.
(Please see the "Saving Chart Defaults" section of the Help Guide for more information.)
|
|
Before changing the instrument or interval, you must select the Data Series you wish to change. If none is selected, any instance of the primary Data Series is changed.
Changing an Instrument via Chart Toolbar
To change an instrument using the chart toolbar:
| 1. | Left mouse click on the instrument drop down menu in the chart toolbar |
| 2. | Select an instrument from the list (for more information about editing this list, please see the Instrument Lists section of the Help Guide for more information.) |
Changing an Interval via Chart Toolbar
To change an interval using the chart toolbar:
| 1. | Left mouse click on the Data Series drop down menu from the chart toolbar |
| 2. | Left mouse click on any of the , , , or menu items. |
Changing and Adding Instruments and Intervals via Keyboard
You can change instruments or intervals by pressing a letter or number key in a selected chart. Within the window that appears, you can change the instrument, interval, or chart type by using the following formats and pressing the "Enter" key when finished. If multiple instruments are displayed in the chart, you can change a specific instrument by left mouse clicking to select it before typing. If no instrument is selected, the primary instrument is changed.
To change an instrument:
|
Type the instrument symbol. (Add the front month for futures instruments) Examples: "ES 12-09" for E-mini S&P 500, "AAPL" for Apple stock or "EURUSD" for Euro/U.S. dollar Forex pair.
|
To change bar series:
|
Type interval value plus the interval suffix (Value +suffix). Examples: "5M" for 5 minute bars, "100T" for 100 tick bars, etc.
|
Available suffixes:
|
Suffix interval:
|
M
|
Minute
|
T
|
Tick
|
V
|
Volume
|
R
|
Range
|
S
|
Second
|
D
|
Day
|
W
|
Week
|
MO
|
Month
|
Y
|
Year
|
RE
|
Renko
|
To change instrument and interval
|
Type the symbol + interval. Example: "AAPL 5M" will change chart to a 5 minute chart of Apple stock.
|
To add additional series of primary instrument
|
Type a plus sign (+) + the interval. Example: "+5M" will add a 5 minute chart of the primary instrument.
|
To add additional series of any instrument
|
Type a plus sign (+) + the instrument and interval. Example: "+AAPL 5M" will add a 5 minute series of Apple stock. If no interval is provided, then the same interval as the primary series will be added.
|
Equities can be added to the NinjaTrader instrument database by typing the instrument symbol followed by the exchange into an open chart and pressing the "Enter" key on your keyboard. For example, you can type "YYY NYSE" to add stock "YYY" mapped to the Nyse. Just typing "YYY" without the exchange will map to the Default exchange and will use the "Default 24/7" session template.
|
Removing a Data Series
There are three ways to remove a Data Series from your NinjaTrader chart:
| • | Open the Data Series window (see the "Understanding the Indicators window" section above), select a Data Series from the applied Data Series list, press the Remove button, and then press the OK button to exit the Data Series window |
| • | Left mouse click to select the Data Series on your chart and then press the Delete button on your keyboard. |
| • | Left mouse click to select the Data Series on your chart, then right mouse click and select the menu item |
The primary Data Series in the applied Data Series list CANNOT be removed once a chart is created.
|
Multiple Data Series
Multiple Data Series objects of all types can be be viewed within a single chart window. There are several ways to add Data Series objects to the chart. Please see the "How to add a Data Series" section above for more information.
The image below shows two Data Series plotted within one chart window:
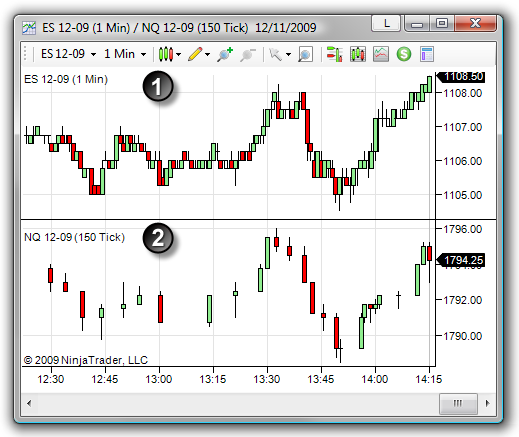
Each instrument is placed in its own panel by default with the scale shown in the right margin of the chart. A maximum of 10 separate panels can be displayed within a single chart window. Instruments and indicators can alternatively be plotted within one panel. The scale of each can be justified to the right, left or overlayed on the panel. Please see the "Understand panels" section of the "Navigating a Chart" page of the Help Guide for more information.
|
Equidistant Bar Spacing
Equidistant Bar Spacing is a chart property that determines whether bars are plotted with an equal distance from each other, or plotted on a horizontal axis with even time spacing. The two images below display the same chart with the property set to "True" (below left) and "False" (below right). When true, the distance between bars is equal throughout the chart. When false, the distance between bars is not necessarily the same. Bars are instead plotted on a fixed x-axis timeline where every inch along the axis represents an equal amount of time. This allows for the benefit of being able to gauge momentum on non-time based charts, such as tick or volume, by visualizing how long it takes to finish building the next bar. Gaps may occur if no bar formed during the time interval. Overlapping bars may occur if bars are formed near the same time period. Both gaps and overlapping can be seen in the below right image. Equidistant Bar Spacing can be enabled or disabled within the Chart Properties window.
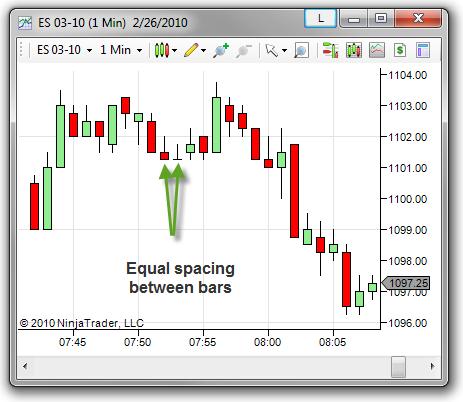
Equidistant Bar Spacing = True
|
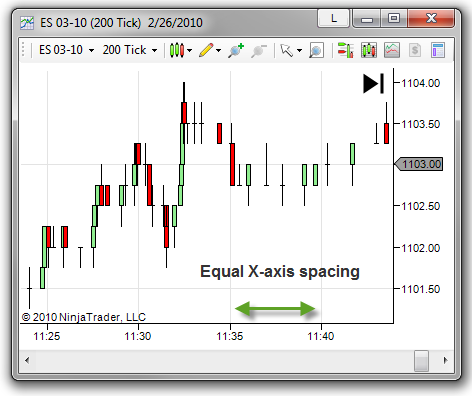
Equidistant Bar Spacing = False
|
Equidistant Bar Spacing with Multiple Data Series
When adding two or more Data Series to a chart, the property "Equidistant bar spacing" will automatically be set to "False" within the Chart Properties window. This is necessary so that mixed Data Series intervals, such as tick and minute, can now be viewed without the natural distortion due to time differences.
Aggregated X-Axis Time Line
When using multiple Data Series with different session templates, NinjaTrader will create an x-axis using the earliest begin time and latest end time of all session templates applied to the Data Series objects on the chart. For example, if instrument A has a session begin time of 7:00 AM and end time of 2:00 PM, instrument B has session begin time of 8:00 AM and end time of 4:00 PM, the chart will have a session begin time of 7:00 AM and end time of 4:00 PM.
|
|
|


