The NinjaTrader Desktop platform provides futures traders with feature-rich charting capabilities, enabling you to create a unique, personalised, and comprehensive charting experience with multiple charts and types across any timeframe. You can customise your charts with over 70 different indicators native to the platform and many more plug-ins available through the NinjaTrader Ecosystem: a third-party marketplace of indicators, strategies, and trading tools built by independent developers.
EU traders can access DAX (FDAX), Micro-DAX (FDXS), Euro Bund, Euro Stoxx 50, and major US index futures—all chartable within the same NinjaTrader Desktop workspace. NinjaTrader is authorised and regulated under MiFID II through PEDSL (licensed by CySEC), providing EU and German traders with a compliant, exchange-listed futures trading environment.
Let's walk through how to personalise your charting setup and customise the NinjaTrader Desktop platform so you can easily place trades, manage orders, and employ automated trade management strategies directly from your charts.

Creating a New Chart
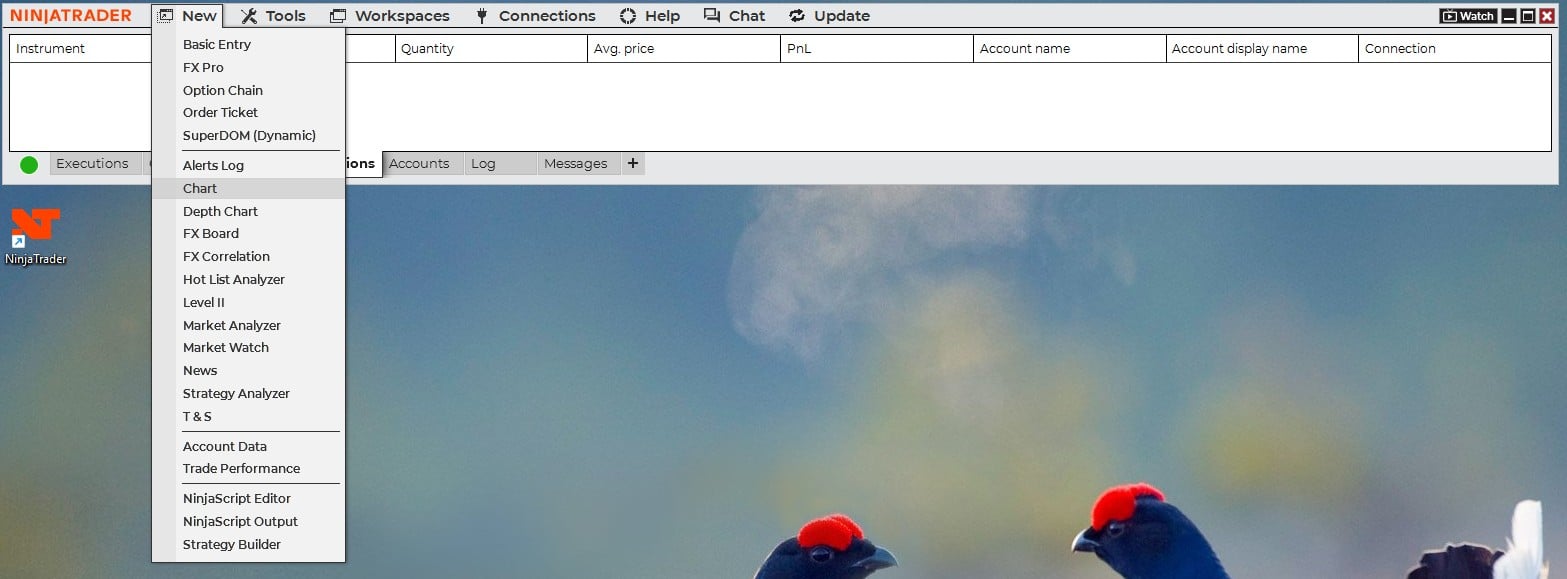
To create a new chart in NinjaTrader Desktop, click on the New option at the top left of the Control Centre, and a drop-down menu will appear. Click on Chart to launch a new dialogue box called Data Series, where you can customise your chart.
Navigating the Setup Window
At the top left of the Data Series window, you'll see a drop-down menu where you can choose the instrument (i.e., the market) you want to analyse. The Select menu will display popular markets to choose from, but you can also type in a market symbol or keyword to see symbols that match your criteria.
Once you select the instrument you want, the dialogue box will populate with two columns. The Applied column on the left will show the instruments you've selected. You can add more than one instrument if you want to chart multiple markets in one chart. The column on the right, called Properties, provides a series of options to customise your chart.
- Data Series: Here you can choose between 15 different chart types, including interday and intraday, range, tic, volume, Heikin Ashi, point and figure (P&F), and more. Right under this, you can choose a value for your time series. The value determines how many units each bar or candle represents for the type of chart. For example, a value of 5 for a minute chart defines a chart with 5-minute bars or candles.
- Chart Style: Here you can choose between 10 different chart style options, including candlestick, open-high-low-close (OHLC), and line on close. You can also modify colours and line widths here.
- Visual: Here you can further customise your charts, including changing the panel (i.e., the section where you want the chart to appear). This option is for charts that will show more than one instrument at a time. For example, you might want to see DAX futures (FDAX) and gold charted next to each other on the same chart. In this case, both data series would have Panel 1 selected so they share the same panel.
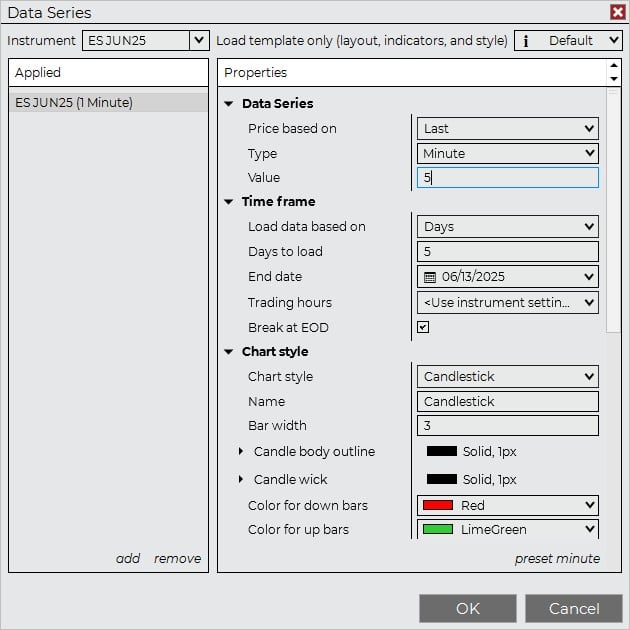
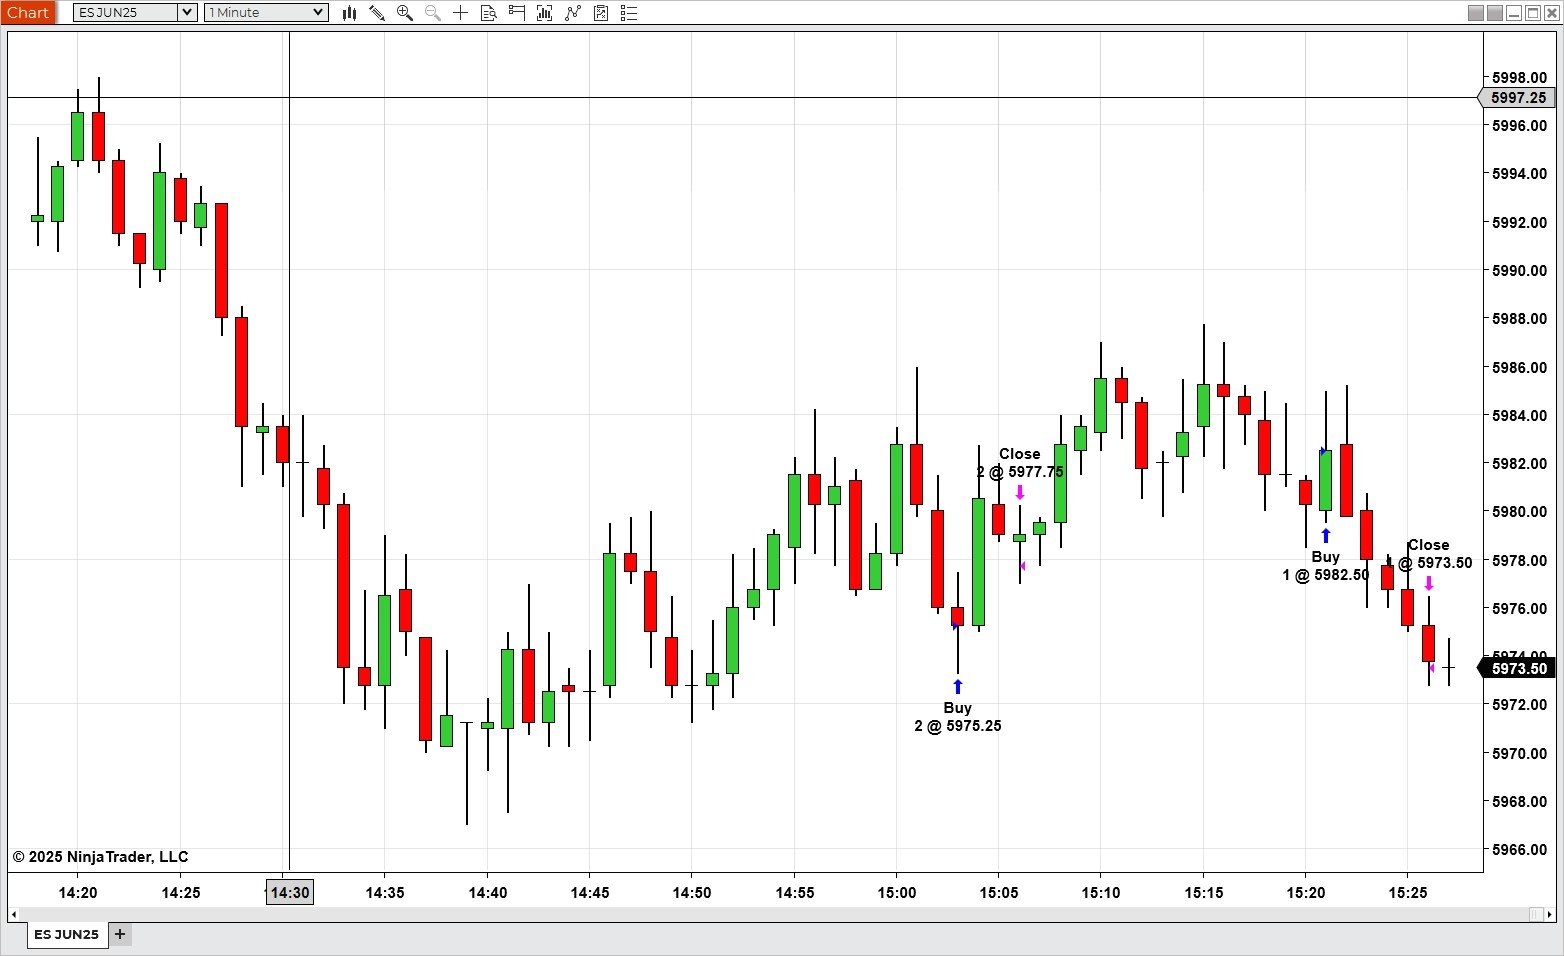
You'll find other customisation features in the Properties section, including the option to plot your trade executions, enabling you to see the time and price at which you make a trade directly on the chart. Once you're happy with your setup, click the OK button at the bottom right, and your chart will launch.
Navigating the Icons
Once your chart launches, you'll see the market and time you chose at the top left of the chart. You can use these drop-downs to quickly change markets and timeframes.
At the top, you'll see the following icons: Chart Style, Drawing Tools, Zoom In/Out, Crosshairs, Chart Trader, Data Series, Indicators, Strategies, and Properties.
Adding Indicators
There are two ways to apply indicators to your charts in NinjaTrader Desktop: you can select the top Indicators icon, or you can right-click on the chart itself, which will open a new menu with Indicators as an option. Once you select Indicators, the Properties box will pop up, displaying three sections. In the upper left, you'll see all the available indicators you can add to your chart, as well as any third-party plug-ins you've downloaded from the NinjaTrader Ecosystem.
Once you scroll through the available indicators, double-click on the one(s) you want to add to your chart, and your selection will populate in the lower-right area, called Configured. By clicking on the indicator in the Configured window, you'll activate the Properties window on the left, where you can configure options unique to that indicator.
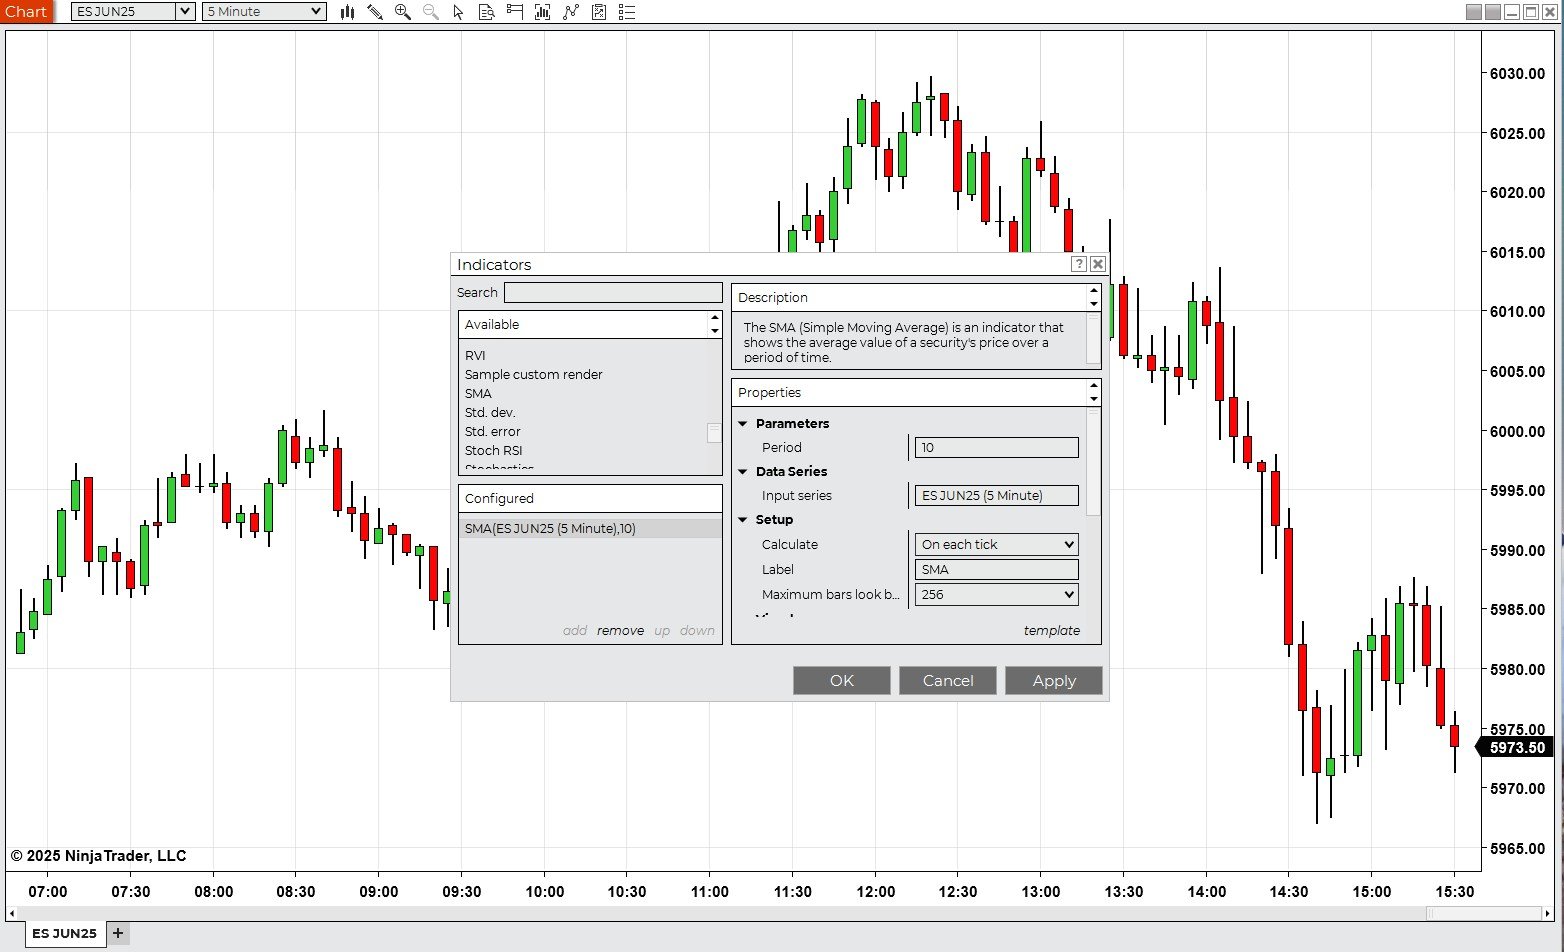
You can apply as many indicators as you like. Once you're ready, click on the Apply and OK button on the bottom right of the Indicators dialogue box, and you'll see your indicator(s) appear on your chart.
Adding and Duplicating Tabs
At the bottom of your new chart, you'll see a tab with the chart name; next to it will be a + sign. Click on the + sign to create a new chart and add as many tabs as you like. A series of tabs makes it easy to toggle between charts quickly, and it's also handy if you trade with a single monitor setup or laptop.
Linking Charts
NinjaTrader Desktop's Instrument Link feature allows you to synchronise charts, the Market Analyzer, and the SuperDOM using colour-coded links, so switching markets updates your entire workspace simultaneously. In the upper right of the chart, the second box from the left is the Instrument Link option, which you can click on to change its colour. By changing the Instrument Link option and other elements to the same colour, you'll link them, enabling those elements to change to a new market simultaneously.
Learn how to use the NinjaTrader Market Analyzer and the NinjaTrader SuperDOM to maximise the power of linked workspaces.
Using Drawing Tools
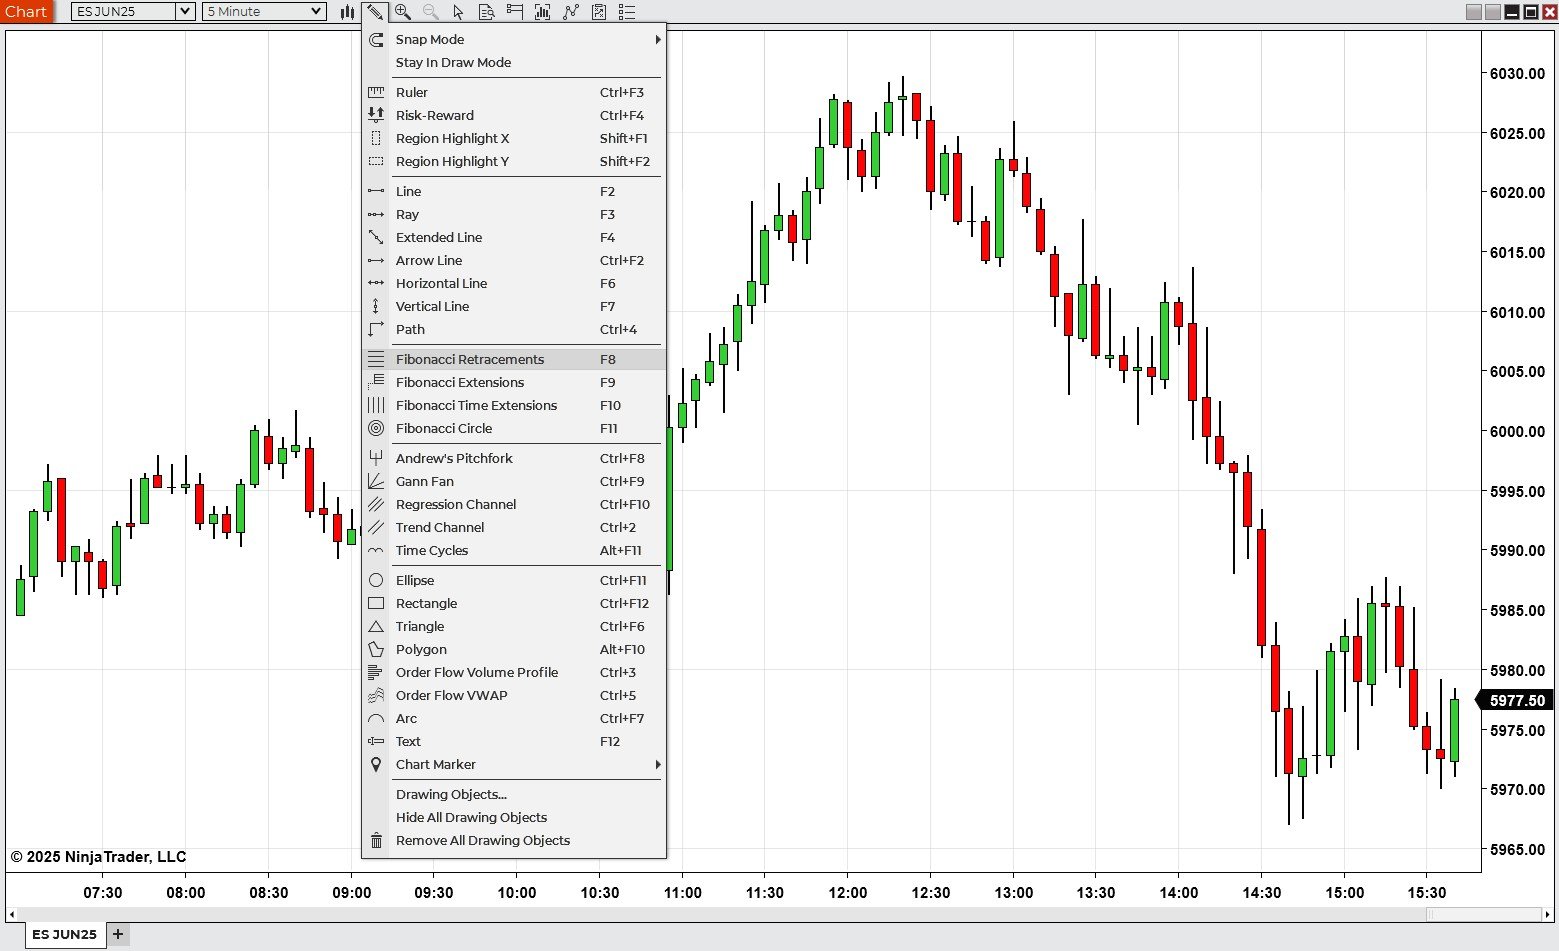
NinjaTrader Desktop gives you access to the Drawing Tools menu at the top of the chart (it looks like a pencil), or you can right-click to select Drawing Tools from the pop-up menu. Your Drawing Tools options are substantial, including trend lines, Fibonacci retracements, region highlight tools, and more. Once you select the option you want, your cursor will be activated, and you can apply the drawing directly to the chart. Note that the drawing tools are dependent on where you click on the chart, and some tools will require more clicks than others, depending on what the tool is trying to achieve.
Trading From the Charts
One of the standout features of NinjaTrader Desktop is the ability to trade directly from the charts. To enable this feature, click on the Trade icon (the one that looks like an electric mixer standing upright).
The default mode of the chart trading icon is Off. Once selected, you can choose Chart Trader or Chart Trader (Hidden). When enabled, the Chart Trader will display a trading module next to the chart. In addition to the standard Buy/Sell trading buttons, you can select the account you want to trade from, your order quantity, and your order type. These fields are important to setting the trade defaults for both Chart Trader modes.
Chart Trader (Hidden) does not display the Trade module next to the chart; when enabled, the chart looks the same as if Chart Trader were in Off mode, but you can trade directly from the chart by right-clicking anywhere in it. The resulting menu will display Buy/Sell options at prices that are dependent upon where you click in the chart.
Once you select your order type, your order will display on the chart at the price selected with the original right-click. If you want to change your order price, left-click and hold the order label in the chart to drag up or down to the desired price. To cancel your order, click on the X attached to the order (found near the y-axis).
Trading EU Markets With NinjaTrader
EU traders can chart and trade a wide range of futures markets directly within NinjaTrader Desktop. DAX futures (FDAX), Micro-DAX (FDXS), Euro Bund, and Euro Stoxx 50 are among the most popular European markets available, alongside major U.S. index futures such as the E-mini S&P 500. All can be charted simultaneously within a single configurable workspace.
NinjaTrader is authorised and regulated under MiFID II through PEDSL (licensed by CySEC). For more on why futures can be a compelling alternative to restricted CFD products, see our guide to futures vs. forex and CFDs.
Elevate Your Trading With NinjaTrader
Charts and the tools they provide are an essential part of a trader's regimen. They can provide insight into market sentiment by way of price and volume history, as well as act as a portal to placing orders because of the analysis the chart provides. While we have detailed a variety of functions that charts in NinjaTrader Desktop are capable of, there is much more to explore. With over 30 dynamic drawing tool objects, over 100 chart indicators, and customisable automated trade management orders, the NinjaTrader Desktop platform offers charting tools that can help you elevate your trading.
Start Trading Today