Coverage for the week of May 8th - May 12th: We examine the bearish tendencies of the June E-Mini Russell 2000, bullish moves from corn futures, the June British Pound future price rally and more.
June E-Mini Russell 2000 Future Weekly Chart
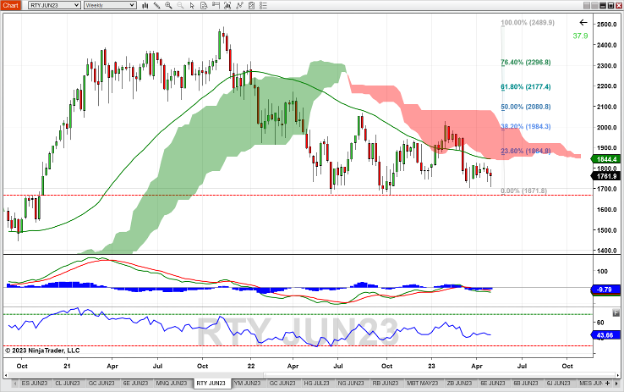
The June E-Mini Russell 2000 future continues to show bearish tendencies on the weekly chart. Price closed down for the second consecutive week, not coming close to crossing above the 52-week moving average nor the bottom of the Ichimoku cloud. MACD is negative and below its signal line, which is a bearish state – a cross above the signal line could indicate a reversal of trend. At 43.75, the RSI is in line with price, trending lower but plenty to go to get to the Overbought level of 30. If price continues to trend down, look for long-term support at 1671. A reverse to the upside might experience resistance at 1840 (bottom of the Ichimoku cloud) and 1865 (23% Fib retracement level from highs in October 2021 to lows in October 2022).

July Corn Future Weekly Chart
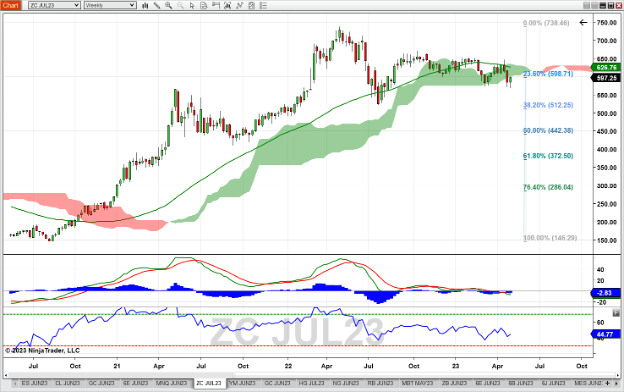
While Corn futures experienced a strong bullish move from the lows in October 2020 to the highs in April 2022, consolidation is present around the 23% Fibonacci level of 600. A bullish attempt to cross the 52-week moving average failed three weeks ago; the result of which was a break below the Ichimoku cloud, which might be seen as a sign of bearishness. The MACD is negative and below its signal line, also bearish. The RSI at ~45 shows little bias either way, though higher peak lows on the RSI while price shows equal peak lows could be seen as bullish divergence. A trend back up in price could see resistance at the 625 – 635 area (52-week moving average and top of the Ichimoku cloud). Support might be found at the 38.2 % Fib retracement level (512) should this market continue to trend downward.

June British Pound Future Weekly Chart
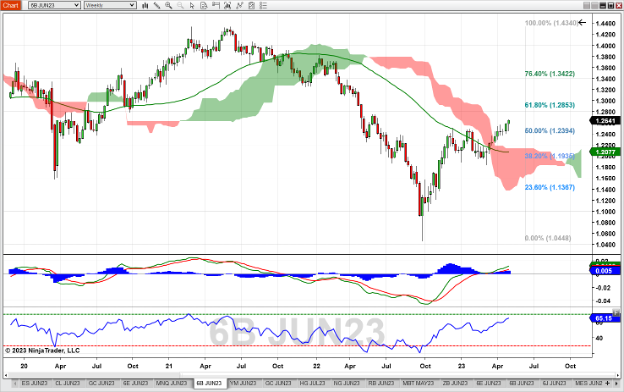
The rally continues in the June British Pound future as price closed higher than the previous week seven out of the last nine candles. Trading well above the 52-week moving average and the Ichimoku cloud, the pound came close to taking out highs from June of last year. The MACD crossed its signal line and turned positive just before price crossed above the 52-week moving average, reinforcing a bullish case. The RSI at 65 is trending closer to the overbought level of 70 – though should it cross above 70, realize that it can stay above 70 for an extended period. Should the uptrend continue, resistance might be found at the 61.8 % retracement level of 1.2853. Support might be found at the 50% Fib retracement level (1.2394) and the top of the Ichimoku cloud (1.2130).

July Copper Future Weekly Chart
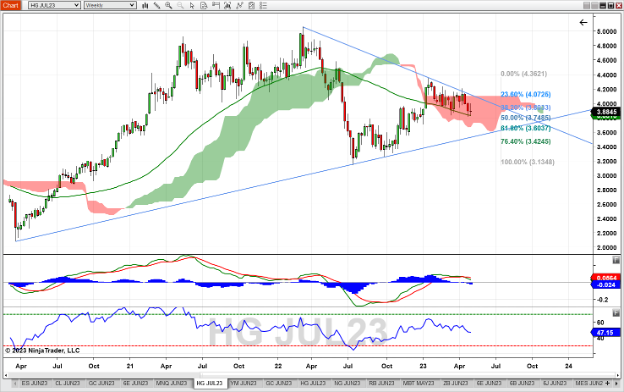
The July Copper future remains mired in the Ichimoku cloud for the 14th straight week, finding support at the 52-week moving average before finishing the week with no substantive advance. A wedge pattern has been developing from the low in March 2020 and the high in March 2022. The MACD, while positive, crossed below its signal line three weeks ago, giving conflicting indications that are not uncommon in consolidating markets. The RSI at 47.35 is in line with price action, showing a slight downtrend. Should this market trend to the upside, look for possible resistance at the top of the wedge and Ichimoku cloud (4.10). If copper crosses below the 52-week moving average, look for support at the 50% Fib.

Economic Reports for the week of May 8th–May 12th
Commentary: This week begins light on economic reports, but with CPI on Wednesday and PPI on Thursday, market participants could get some early evidence on whether the FOMC’s approach to tackling inflation is working. EIA reports for Petroleum and Natural Gas could insert volatility for crude oil (CL), gasoline (RB) and natural gas (NG) markets on Wednesday and Thursday. Monthly supply and demand reports for the grains markets arrive on Friday at noon ET – this could move the corn, wheat, soybean, cotton and related markets. More than 1,000 companies are scheduled to report earnings next, though most of them are small caps. One notable exception is Walt Disney, found in the S&P 500 and Dow Jones indices, which reports after market close Wednesday.
| Date | Economic Reports |
|---|---|
| Monday, May 8th | 10:00 AM ET: Wholesale Inventories (Preliminary) 11:00 AM ET: Export Inspections 4:00 PM ET: US: Crop Progress |
| Tuesday, May 9th | 6:00 AM ET: NFIB Small Business Optimism Index 12:05 PM ET: New York Federal Reserve Bank President John Williams Speech* 4:30 PM ET: API Weekly Oil Stocks |
| Wednesday, May 10th | 7:00 AM ET: MBA Mortgage Applications 8:00 AM ET: Bank Reserve Settlement 8:30 AM ET: CPI*** 10:00 AM ET: Atlanta Fed Business Inflation Expectations 10:30 AM ET: EIA Petroleum Status Report* 2:00 PM ET: Treasury Statement 4:05 PM ET: Walt Disney Reports Earnings (EPS Estimated $0.88) |
| Thursday, May 11th | 8:30 AM ET: Export Sales 8:30 AM ET: PPI-Final Demand*** 8:30 AM ET: Jobless Claims*** 10:30 AM ET: EIA Natural Gas Report* 4:30 PM ET: Fed Balance Sheet |
| Friday, May 12th | 8:30 AM ET: Import and Export Prices 10:00 AM ET: Consumer Sentiment* 12:00 PM ET: USDA Supply/Demand - Corn, Wheat, Soybean, Cotton @USDA *** 12:00 PM ET: Crop Production 1:00 PM ET: Baker Hughes Rig Count 7:45 PM ET: St. Louis Federal Reserve Bank President James Bullard Speech |
*** Market Moving Indicators
* Merit Extra Attention
Get Started with NinjaTrader
NinjaTrader supports more than 800,000 traders worldwide with a powerful and user-friendly trading platform, discount futures brokerage and world-class support. NinjaTrader is always free to use for advanced charting and strategy backtesting through an immersive trading simulator.Download NinjaTrader’s award-winning trading platform and get started with a free trading demo with real-time market data today!

