In this week’s coverage, we analyze the pullback in the E-mini Dow Jones futures, the downtrends in copper and Euro FX futures, and the uptrend in crude oil futures. We also examine the economic reports expected next week.
December E-Mini Dow Jones Index Futures Weekly Chart
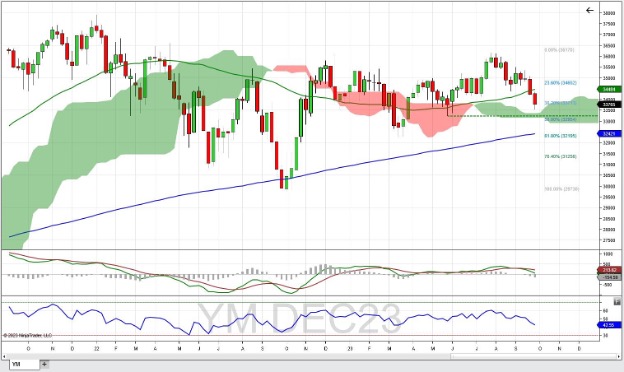
December E-mini Dow Jones Index futures continued the bearish trend that began at the end of July, extending the break below the 52-week moving average. The MACD showed a bearish cross about a month ago and the MACD line is poised to cross below 0, reinforcing a bearish trend. RSI is trending down in line with the price trend. Should this downtrend continue, support might be found at the top of the Ichimoku cloud (~33,370), but with the cloud being so thin at this point, a breakdown below the cloud is a good possibility. Further support could be found at the 61.8% retracement level (~32,200), which coincides with the 200-week moving average. A bullish reversal might find resistance at the 23.6% retracement level (~34,650).

November Crude Oil Futures Weekly Chart
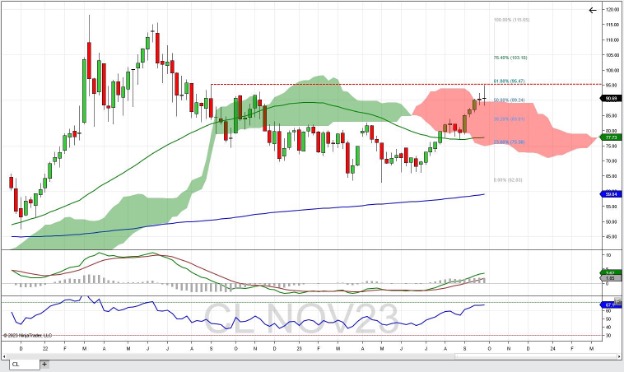
November crude oil futures continued the rally that began at the beginning of July; the top of the Ichimoku cloud acted as support for the second week in a row. The highs on the week hit resistance at the 61.8% Fibonacci retracement level of the trend that began in June of 2022 and ended in May of 2023. Price is well above the 52-week and 200-week moving averages. MACD continued to be bullish with both a positive MACD line and histogram. RSI is trending up with price and at 67 is getting close to that overbought level of 70. Should this trend continue, resistance could be found again at the 61.8% Fibonacci level which coincides with the high from September of 2022, the last time we traded in this area (~95.27). A pullback might find support at the top of the Ichimoku cloud (~89.50) and further down at the 38.2% retracement level (~83.00).

December Copper Futures Weekly Chart
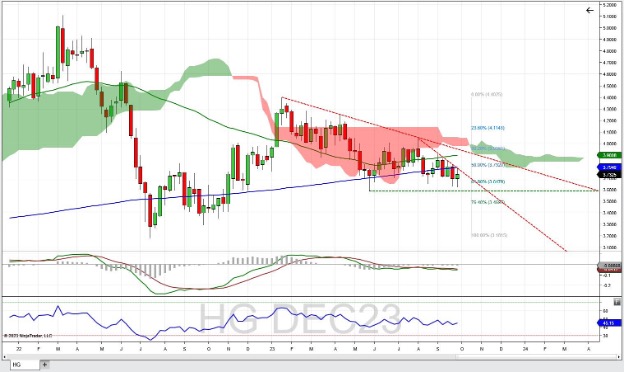
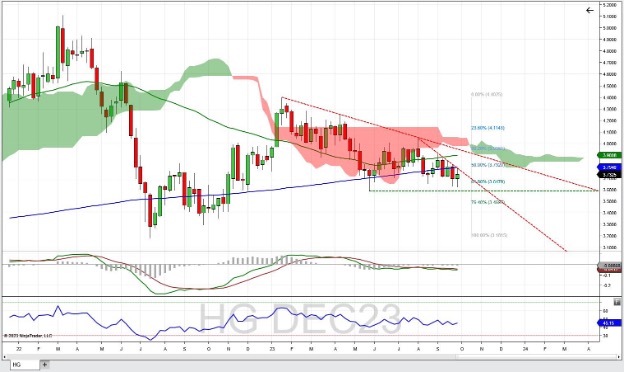
December copper futures had a little bit of a rally, but couldn't finish the middle of the prior week’s candle. It also printed a lower high and a lower low, which is bearish. The 61.8% Fibonacci retracement level from the trend that started in July of 2022 and finished in February of 2023 held as support for the second week in a row. Price is trading below the Ichimoku cloud, the 52-week moving average, and the 200-week moving average, reinforcing the bearish bias. The MACD is negative as is its histogram, indicating bearishness. The RSI is flapping in the wind at 45. Should this market rebound, resistance might be found at the confluence of the 200-week moving average, the recent resistance trendline, and the 50% Fib retracement (~3.80). If the bearish trend continues, support might be found at a previous low from end of June (~3.60).

December Euro FX Futures Daily Chart
December Euro FX futures finished the week with 11 consecutive down weeks in a row, which the Euro FX hasn't seen in the last seven years. While price has been below the 52-week and 200-week moving averages for the past month, last week's bearish action pushed it out of the cloud to the downside. The 50% Fibonacci level of the retracement of the trend that started in September of 2022 and ended in July of 2023 held as support. The MACD and its histogram are both negative (bearish) and the RSI has been trending downward since July, and is getting near the oversold level of 30 (also bearish). Should this downtrend continue, support could be found at the 61.8% Fibonacci retracement level (~1.0405). A rally might find resistance at the top of the Ichimoku cloud (1.0750).

Economic Reports for the week of October 2 – October 6
The labor market is in focus this week, with Job Openings on Tuesday, ADP Employment on Wednesday, Challenger Job-Cuts and Jobless Claims on Thursday, and the Employment Situation on Friday.
Monday is big for manufacturing reports – in addition to PMI reports coming in for European countries throughout the early morning, PMI releases at 9:45 AM ET, and Construction Spending and ISM Manufacturing drop at 10 AM ET.
PMI Composite, ISM Services and Factory Orders arrive Wednesday morning in the 9:45 – 10 AM ET time span. Plenty of Federal Reserve Bank Presidents and Governors are speaking this week – Chair Powell speaks at 11 AM ET Monday, and while his comments may have the most weight, some market participants will listen to other Fed speakers to see if there is a unified message ahead of the next meeting on November 1. OPEC+ meets Wednesday, so be ready for the possibility of volatility in the energy markets throughout the session.
|
Date |
Economic Reports |
|---|---|
|
Monday, October 2 |
9:45 AM ET: PMI Manufacturing Final |
|
Tuesday, October 3 |
8:00 AM ET: Motor Vehicle Sales |
|
Wednesday, October 4 |
All Day: OPEC+ Joint Ministerial Monitoring Committee |
|
Thursday, October 5 |
7:30 AM ET: Challenger Job-Cut Report |
|
Friday, October 6 |
8:30 AM ET: Employment Situation *** |
***Market Moving Indicators
*Merit Extra Attention
Ready For More?
Learn the basics of technical analysis with our free multi-video trading course, “Technical Analysis Made Easy.”
Join our daily livestream events as we prepare, analyze and trade the futures markets in real time.
Start Trading Futures With NinjaTrader
NinjaTrader supports more than 800,000 futures traders worldwide with our award-winning trading platforms, world-class support and futures brokerage services with $50 day trading margins. The NinjaTrader desktop platform is always free to use for advanced charting, strategy backtesting, technical analysis and trade simulation.
Get to know our:
- Futures brokerage: Open an account size of your choice—no deposit minimum required—and get free access to our desktop, web and mobile trading platforms.
- Free trading simulator: Sharpen your futures trading skills and test your ideas risk-free in our simulated trading environment with 14 days of livestreaming futures market data.
Better futures start now. Open your free account to access NinjaTrader’s award-winning trading platforms, plus premium training and exclusive daily market commentary.

